
Chromosome PPT Wide Template – Highly Visual Design
J0400013
- Last Update 01/07/2025
- File Size 36.1MB
- # of Slides 35
- File Format PPTX
- Slide Ratio 16:9
- Color
Slide Preview


Keywords
About the Product
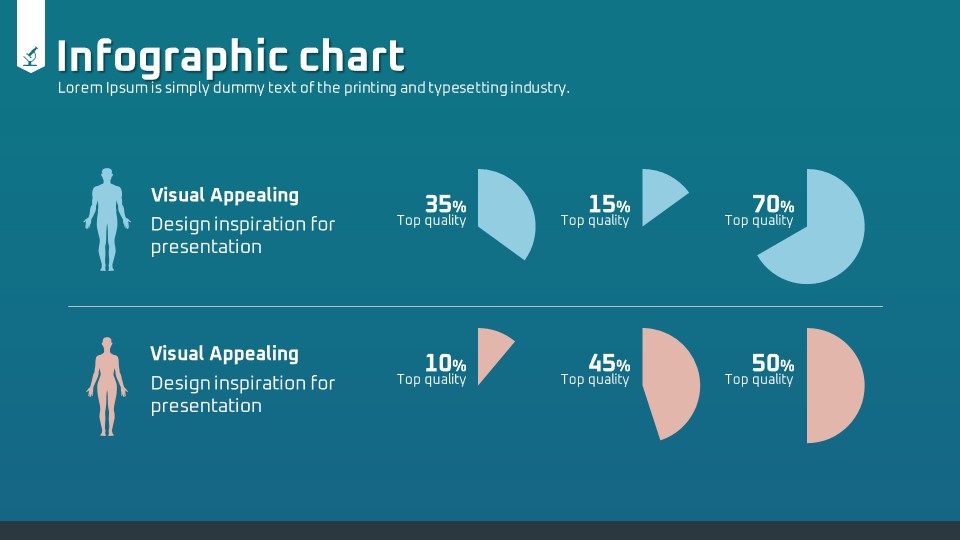
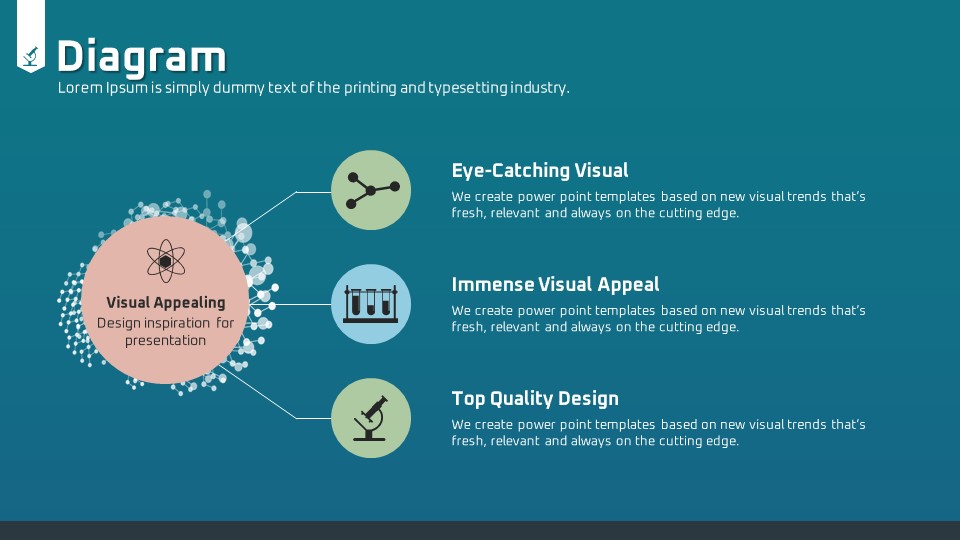
A professional PowerPoint template designed for science and medical presentations, featuring a teal background with molecular network illustrations. This 35-slide deck covers everything from a title slide to introduction infographics, Venn-style comparison diagrams, four-quadrant analysis slides, VS comparison infographics, doughnut charts, and data tables. White typography is paired with soft pink, green, and beige accent colors arranged in a clean two-column grid layout, balancing text and visual elements effectively. Built-in science icons including microscopes, test tubes, and atomic symbols make this template immediately usable for research presentations, medical service introductions, and academic lectures. Provided in PPTX format for full editing flexibility across text, colors, and shapes, optimized for 16:9 widescreen displays.
Usage Points
-
Main Usage
Ideal for life science, medical, and research professionals who need to present study findings, introduce medical services, or deliver academic lectures. The molecular and chromosome visuals reinforce scientific credibility and subject clarity throughout the presentation.
-
How to Use
Open the PPTX file and replace placeholder text, numbers, and images with your own content. Work through slides in order—from the title slide through charts and data tables—to build a complete, polished presentation without starting from scratch.
-
Recommended For
Recommended for life science and medical researchers, hospital and pharmaceutical marketing teams, graduate students presenting thesis work, and science educators who need a visually consistent and professionally structured slide deck.
-
Slide Structure
The 35-slide set includes a title slide, numbered step infographic introduction, Venn-style comparison diagram, four-quadrant circular analysis slide, VS comparison infographic with science icons, doughnut charts with numeric highlights, and structured data table slides.
Related Products
-

Medical Presentation Template for Surgery – Professional and Sleek Design
#Science/Medical
-

Virus PowerPoint Template – Modern and Professional Design
#Science/Medical
-

Chemistry Lab Presentation Template - Eye-Catching Visual Design
#Science/Medical
-

Science Experiment Presentation Template – Creative Visual and Design
#Science/Medical
