Water Drop Shape Graph – Visualizing Market Share
RJ0400013_8
- Last Update 05/21/2025
- File Size 0.3MB
- # of Slides 2
- File Format PPTX
- Slide Ratio 16:9
- Color
Keywords
- #Content-Based Slides
- #Design-Based Slides
- #Product/Service Introduction
- #Market and Competitor Analysis
- #Diagram
- #Graph
- #Other
- #Development Status
- #Market Share
- #Cluster
- #Column
- #Closed Cluster Diagram
- #Grouped Column
- #16:9
- #horizontal bar chart PowerPoint
- #bar graph slide template
- #5-item comparison chart
- #market share visualization
- #data chart PowerPoint download
About the Product
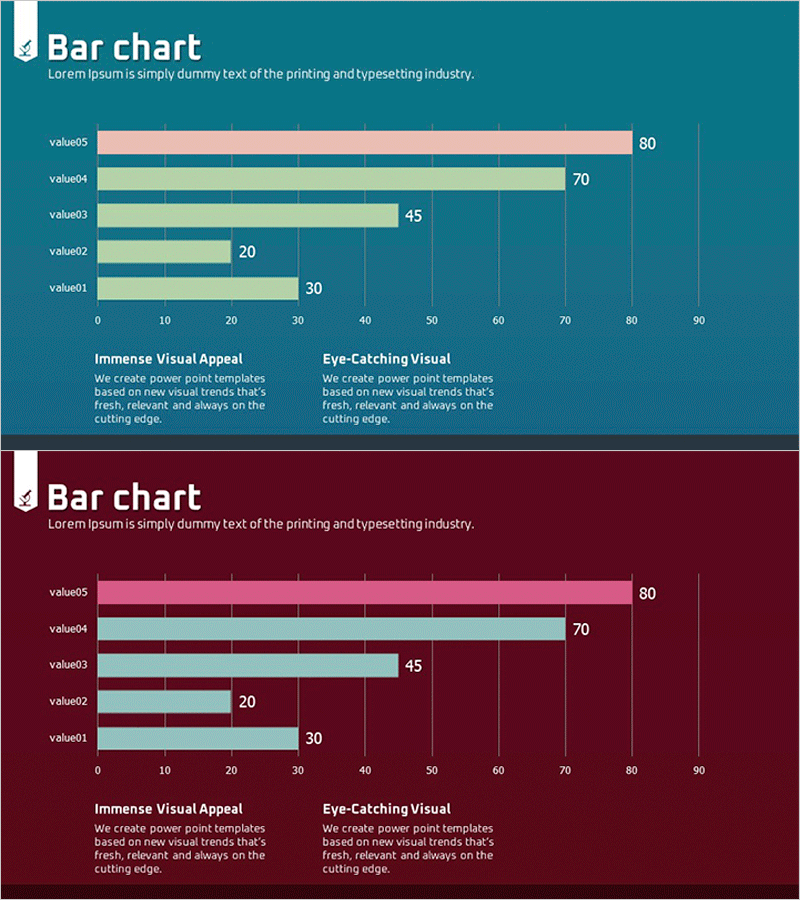
A two-slide PowerPoint presentation featuring horizontal bar charts for comparing five data values. The first slide uses a teal background with multi-colored bars (pink, light green, sky blue, teal, dark blue), while the second employs a wine-red background with the same color scheme. Each bar is labeled with values (80, 70, 45, 20, 30) and aligned to a 0–90 horizontal axis with clear gridlines for precise data visualization. Ideal for market share analysis, sales performance comparison, and quantitative reporting in business presentations.
Usage Points
-
Main Usage
Displays five data points as horizontal bars to enable quick comparison of relative values, rankings, and performance differences. Perfect for presenting market share, revenue, customer satisfaction scores, KPIs, and any quantitative metrics requiring side-by-side comparison.
-
How to Use
Each bar length and color represents a distinct data value. Choose the teal background for a bright, trustworthy tone or the wine-red background for a premium feel depending on presentation context. Add labels and legends to clarify data meaning and enhance audience understanding.
-
Recommended For
Ideal for marketing, sales, finance, and executive reports analyzing market trends, competitor benchmarking, and quarterly performance. Suitable for investor presentations, business proposals, and strategic planning meetings. Recommended for any professional needing to compare five or fewer quantitative data points.
-
Slide Structure
Two-slide set with identical layouts: title area, five horizontal bars (value01–value05), numeric labels, 0–90 horizontal axis, gridlines, and legend section. Bar colors remain consistent across both slides; only background color changes (teal vs. wine-red).
Related Products
-

Business Development Status Diagram – Market Share and Competitive Analysis
#Product/Service Introduction #Market and Competitor Analysis #Diagram
-

Comparative Analysis Graph of Work Progress Status – Visual Data Insights
#Product/Service Introduction #Business Introduction #Diagram
-

Market Share Donut Pie Chart
#Product/Service Introduction #Market and Competitor Analysis #Diagram
-

Leather Material Presentation Template Column Chart
#Market and Competitor Analysis #Graph #Other
