Weather Status Analysis Graph
RJ0400013_7
- Last Update 05/21/2025
- File Size 0.4MB
- # of Slides 2
- File Format PPTX
- Slide Ratio 16:9
- Color
Keywords
- #Content-Based Slides
- #Design-Based Slides
- #Business Strategy
- #Market and Competitor Analysis
- #Diagram
- #Other
- #Step-by-Step Schedule Plan
- #Competitive Advantage
- #Cluster
- #Closed Cluster Diagram
- #Silhouette
- #16:9
- #pie chart PowerPoint slide
- #infographic presentation template
- #demographic data visualization
- #gender comparison chart
- #ratio analysis slide
About the Product
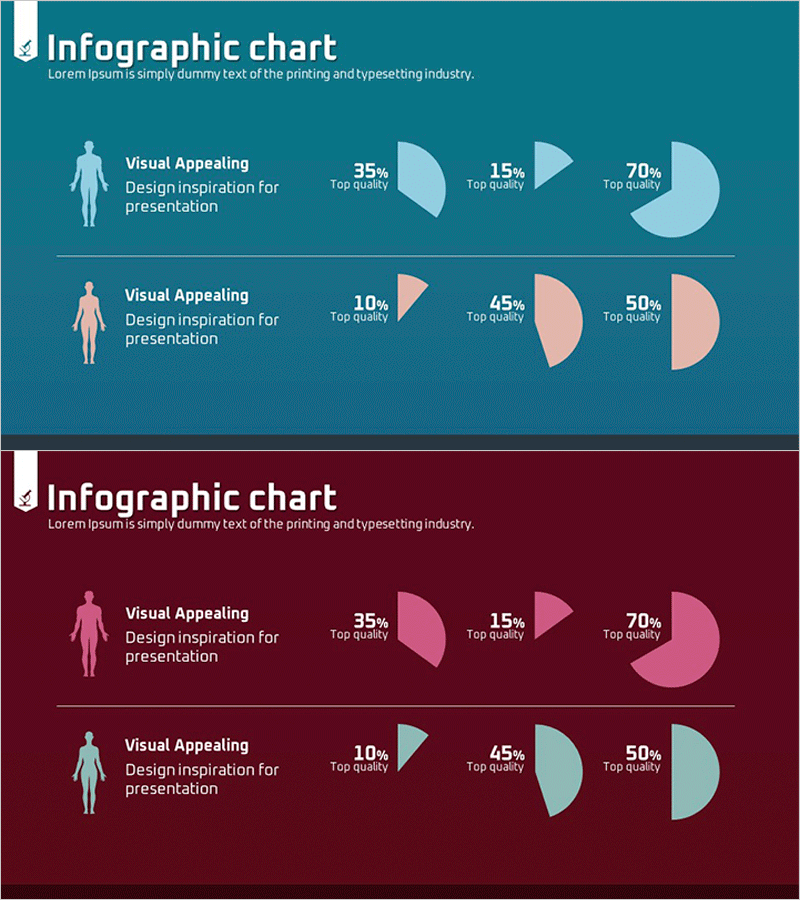
An infographic PowerPoint slide designed for demographic and gender-based data comparison analysis. Features silhouette icons paired with pie charts on teal and pink dual-tone backgrounds, ideal for market segmentation, customer profiling, and population analysis. Each row contains three pie charts displaying ratios, composition, and market share with clear visual hierarchy. Fully editable PPTX template ready for immediate use in presentations, reports, and marketing strategy documents.
Usage Points
-
Main Usage
Visualize demographic data, market segmentation, and customer profile comparisons using pie charts. Effectively communicate gender, age group, or segment-based ratio differences to support decision-making, strategy development, and stakeholder presentations.
-
How to Use
Input actual data into each pie chart to adjust percentages and proportions. Customize the teal and pink color scheme to represent different groups or categories. Edit percentage labels directly to match your presentation requirements and data insights.
-
Recommended For
Marketing, sales, HR, and executive presentations. Ideal for market research reports, customer analysis briefs, workforce demographics, business plan market analysis sections, and competitive positioning documents.
-
Slide Structure
2-row × 3-column pie chart layout. Left side features male and female silhouette icons; right side displays three pie charts per row (1–3 segments each). Teal and pink background rows enable visual group differentiation and comparison emphasis.
Related Products
-

Introducing Services for Business Partners – Icon Box Diagram
#Product/Service Introduction #Business Strategy #Diagram
-

Diagram Slide for Marketing Promotion Stage
#Business Strategy #Diagram #Step-by-Step Schedule Plan
-

Challenges to Improve Korea's Image Slide – Analysis by Age
#Market and Competitor Analysis #Diagram #Graph
-

Growth Rate Comparison Graph – Optimized for Market Analysis
#Market and Competitor Analysis #Diagram #Graph
