Science Business Goals Overlay Diagram
RJ0400013_26
- Last Update 05/20/2025
- File Size 0.3MB
- # of Slides 2
- File Format PPTX
- Slide Ratio 16:9
- Color
Keywords
- #Content-Based Slides
- #Design-Based Slides
- #Business Vision and Strategy
- #Marketing Plan and Strategy
- #Diagram
- #Business Strategy
- #Marketing Strategy
- #Flow
- #Converging Flow Diverging Flow
- #16:9
- #bidirectional arrow diagram PowerPoint
- #divergence convergence diagram
- #two-tone comparison slide
- #business strategy visualization
- #how to create arrow diagram in PowerPoint
About the Product
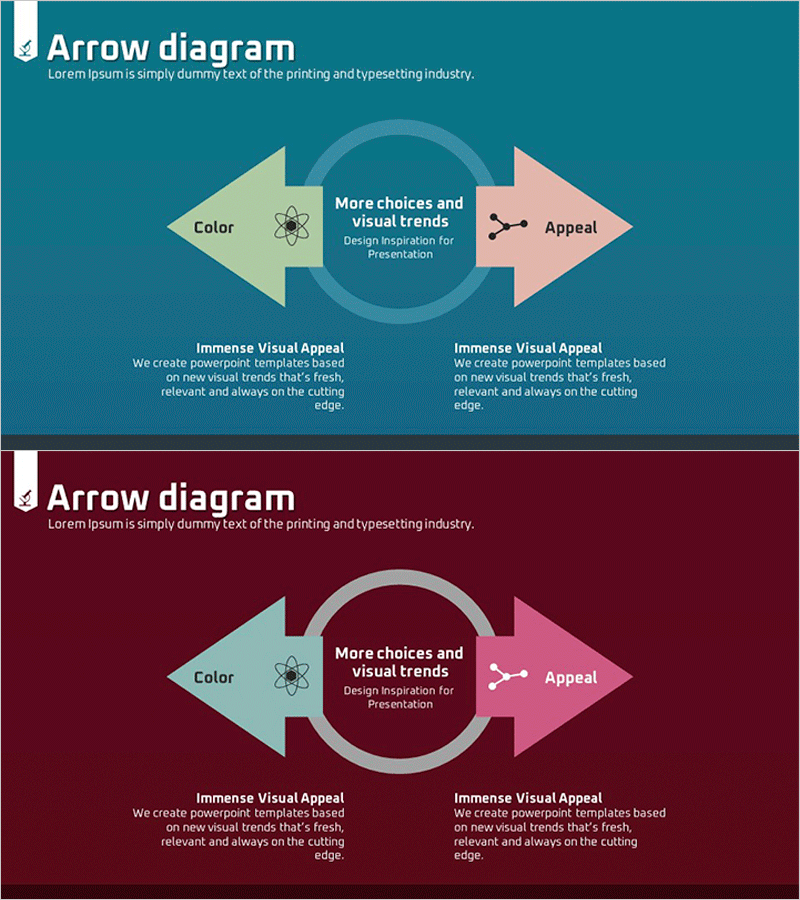
A bidirectional arrow diagram PowerPoint slide with a central circular hub and two symmetrical arrows extending left and right in contrasting tones. The teal background features a pale yellow-green arrow on the left and a soft pink arrow on the right, each with dedicated text and icon areas. The central circular hub provides space for core messaging, making this design ideal for visualizing opposing concepts, alternative choices, strategic directions, or comparative analysis. The 2-slide set includes both teal and deep burgundy background versions, allowing you to match your presentation's visual tone. Perfect for business objectives, strategy comparisons, decision-making frameworks, and research findings in scientific or corporate contexts.
Usage Points
-
Main Usage
Visualize and compare two opposing or complementary concepts, strategic options, or directional choices simultaneously. The symmetrical left-right arrow layout with central hub creates a balanced composition that clearly communicates decision points, strategic alternatives, and comparative relationships.
-
How to Use
Enter comparison subjects, characteristics, or advantages in each arrow section. Place the common theme, decision criteria, or core question in the central circular hub. Customize icons, colors, and text sizing to adjust emphasis. Switch between teal and burgundy background versions to maintain visual consistency throughout your presentation.
-
Recommended For
Executive strategy presentations, competitive analysis for product launches, investment decision-making decks, organizational restructuring announcements, research findings comparisons in academic and scientific fields, marketing teams evaluating alternative campaigns, and R&D teams presenting technical trade-offs.
-
Slide Structure
2-slide set with identical layouts but different background colors (teal and deep burgundy). Each slide features a central circular hub with text input area and two symmetrical bidirectional arrows (2 nodes total). Arrow sections include dedicated spaces for text and icons, enabling flexible content customization and visual hierarchy control.
Related Products
-

Efficient Structure & Content Strategy – A Stepping Stone for Business Growth
#Business Vision and Strategy #Marketing Plan and Strategy #Diagram
-

Snow Mountain Theme Infinite Diagram – Business Strategy Sharing
#Business Vision and Strategy #Marketing Plan and Strategy #Diagram
-

Business Strategy 3D Cylinder Diagram – Visualization of Business Vision and Strategy
#Business Vision and Strategy #Marketing Plan and Strategy #Diagram
-

Business Strategy Silhouette Diagram
#Business Vision and Strategy #Marketing Plan and Strategy #Diagram
