Competitor Analysis Graph – Securing Market Advantage
RJ0400013_9
- Last Update 05/21/2025
- File Size 0.9MB
- # of Slides 2
- File Format PPTX
- Slide Ratio 16:9
- Color
Keywords
About the Product
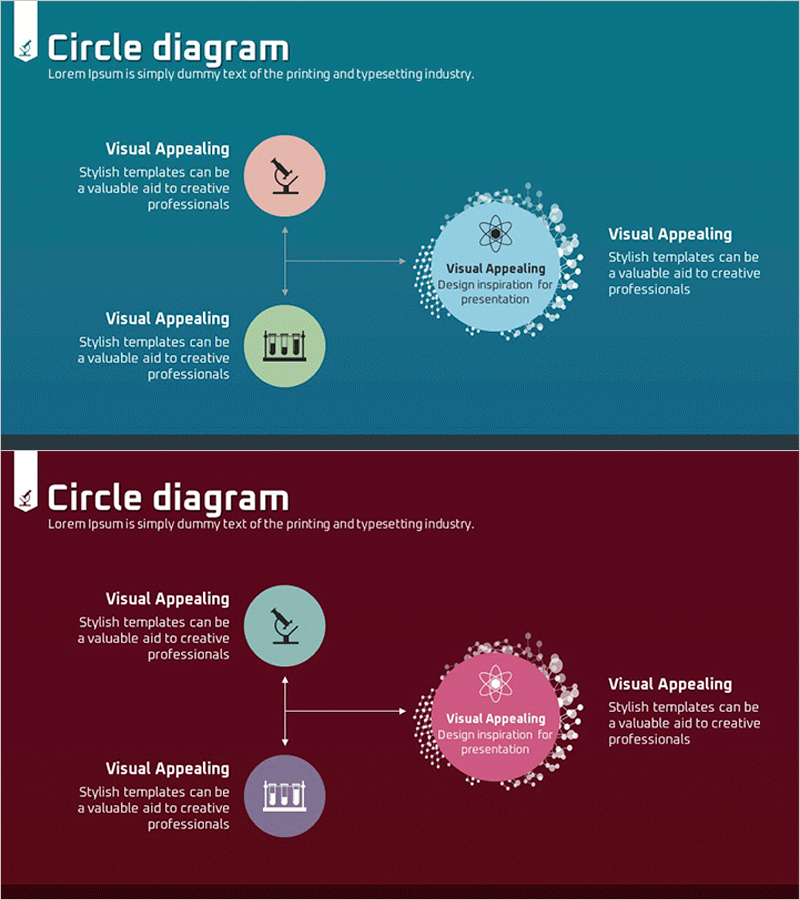
A radial cycle diagram PowerPoint slide designed to visualize competitor analysis and market positioning strategy. The structure radiates from a central concept to three surrounding nodes, enabling simultaneous representation of competitive factors, market positioning, and differentiation strategy. Provided in two color versions—teal background and wine background—with icons and text areas in each node. Ready to use immediately in presentation decks, strategic reports, and executive briefings to strengthen the competitive analysis section.
Usage Points
-
Main Usage
Visualizes competitor analysis, market positioning, and differentiation strategy by radiating from a central concept to three surrounding elements. Used in executive reports, strategic presentations, and marketing planning documents to strengthen the competitive landscape analysis section.
-
How to Use
Enter the core analysis subject (e.g., your company, competitive market, differentiation strategy) in the central circular node. Fill the three surrounding nodes with competitive factors, strengths, and weaknesses. Edit icons and text in each node to customize for your presentation context.
-
Recommended For
Recommended for strategy planning teams, marketing professionals, executive report writers, and business development managers presenting competitor analysis, market advantage strategies, and positioning analysis. Ideal when comparing and analyzing three competitive factors simultaneously.
-
Slide Structure
2-slide set. Slide 1: Teal background with central light pink circular node (core concept), upper-left light peach node, lower-left light yellow node, right light blue dotted circular node (emphasis), and connecting arrows. Slide 2: Wine background with identical structure in different colors (light blue, light purple, light pink nodes).
Related Products
-

Bell Charts for Various Topics – Market Competition Analysis
#Market and Competitor Analysis #Graph #Market Analysis
-

Segmented Bar Graph and Line Graph – Ideal for Market Analysis
#Market and Competitor Analysis #Graph #Market Analysis
-

Pig Family and Market Analysis Graph Slide
#Market and Competitor Analysis #Graph #Market Analysis
-

Line Chart of the Violence Survey – Market Analysis and Competitive Advantage
#Market and Competitor Analysis #Graph #Market Analysis
