Weather Change Diagram – Product and Service Differentiation
RJ0400013_5
- Last Update 05/21/2025
- File Size 0.3MB
- # of Slides 2
- File Format PPTX
- Slide Ratio 16:9
- Color
Keywords
- #Content-Based Slides
- #Design-Based Slides
- #Product/Service Introduction
- #Marketing Plan and Strategy
- #Diagram
- #Differentiation Strategy for Products/Services
- #Marketing Strategy
- #Cluster
- #Chain Diagram
- #16:9
- #connected diagram PowerPoint
- #weather change slide template
- #4-step process diagram
- #product differentiation strategy PPT
- #marketing planning slide
About the Product
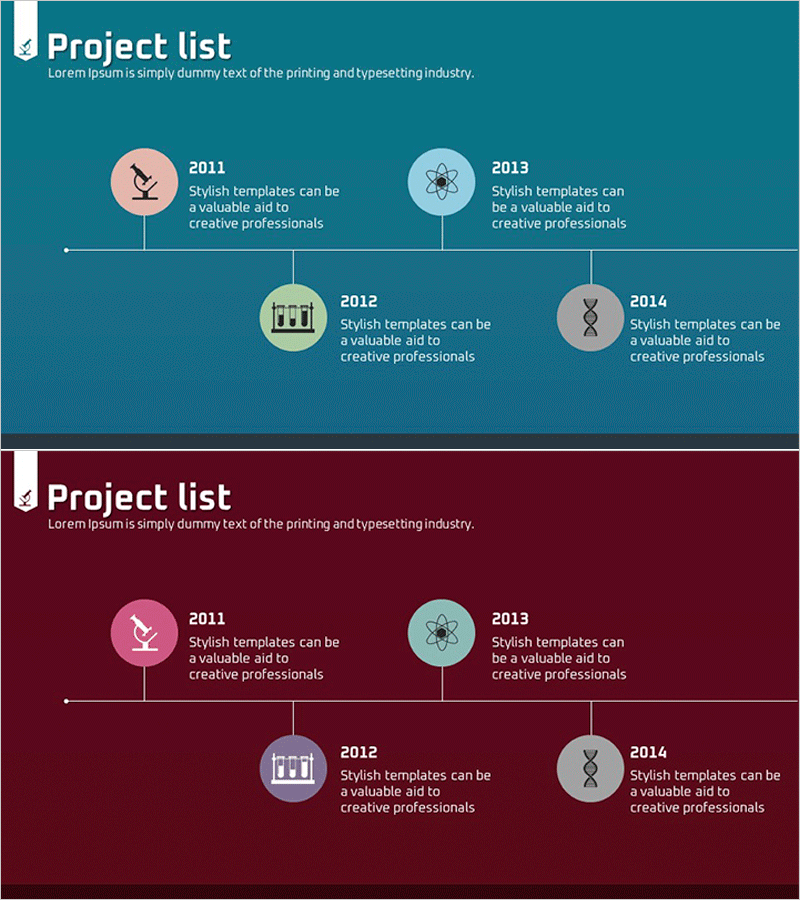
A connected diagram PowerPoint slide that visualizes product and service differentiation strategies. Four circular nodes linked by a central connection line feature weather-themed icons (sun, cloud, lightning, snow) to intuitively represent step-by-step processes or state transitions. Set against a teal background with pastel-colored nodes (pink, light green, sky blue, gray), this slide is ready for immediate use in presentations and marketing planning documents. Comprising 2 slides in 16:9 widescreen format and PPTX file type, it is fully editable in all PowerPoint versions.
Usage Points
-
Main Usage
Visually represents step-by-step changes or transitions in products or services while emphasizing differentiation points from competitors. Serves as a key slide in marketing strategy presentations, new product introductions, and business process explanations to enhance audience comprehension.
-
How to Use
Input text describing product features, service stages, or market positioning into each node, and replace icons as needed to match your presentation context. The teal background and pastel color scheme are already harmoniously configured, allowing immediate use without additional design work.
-
Recommended For
Marketing professionals, product planning teams, sales executives, business report writers, startup pitch presenters, and consulting firm consultants preparing strategy documents, proposals, and business plans.
-
Slide Structure
Four circular nodes (approximately 80px diameter) arranged in two rows above and below a central horizontal line, connected by linking lines. Each node contains a weather icon and text input area, with arrows or lines between nodes expressing causality, sequence, or connectivity. Two slides provided with variations and application examples.
Related Products
-

Business Service Differentiation Strategy Diagram – Cluster Approach for Effective Marketing
#Product/Service Introduction #Marketing Plan and Strategy #Diagram
-

Product Idea Differentiation Strategy – Designing for Uniqueness and Attention
#Product/Service Introduction #Marketing Plan and Strategy #Diagram
-

Gradient Color Cycle Diagram – Product and Service Strategy
#Product/Service Introduction #Marketing Plan and Strategy #Diagram
-

Successful Global Marketing Strategy Diagram
#Product/Service Introduction #Marketing Plan and Strategy #Diagram
