Weather Area Diagram – Centralized Expansion
RJ0400013_14
- Last Update 05/20/2025
- File Size 0.3MB
- # of Slides 2
- File Format PPTX
- Slide Ratio 16:9
- Color
Keywords
About the Product
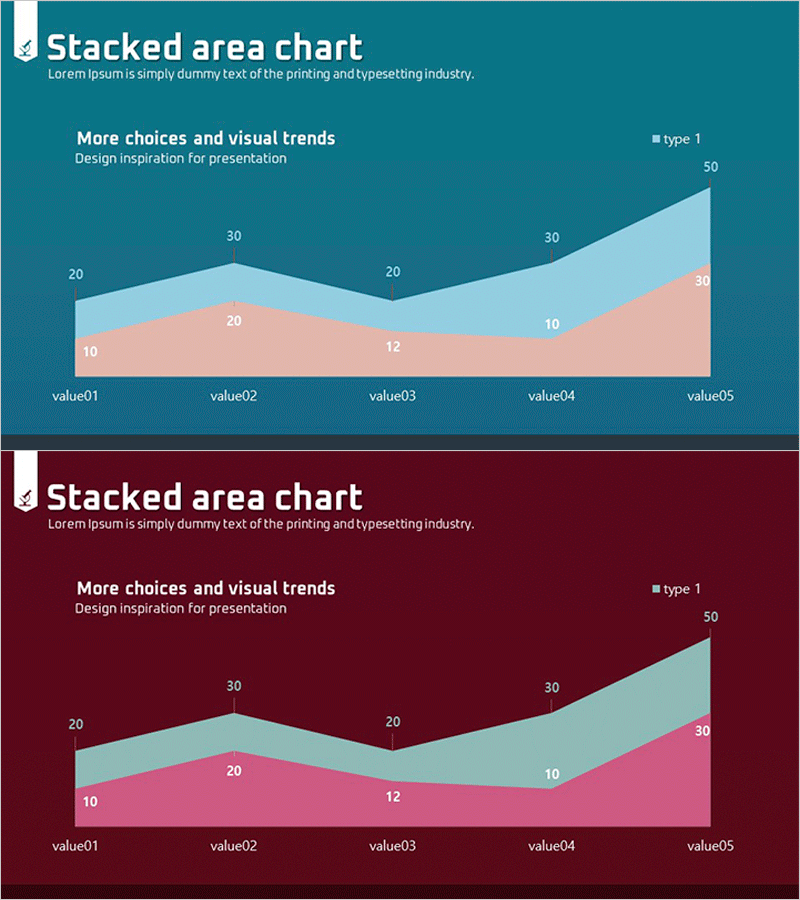
A stacked area chart PowerPoint slide that visualizes multi-series data trends over time. Set against a teal background, light blue and pink areas overlap to display cumulative data across five data points (value01 through value05) for easy comparison. Numeric labels on each area segment ensure precise value communication, while smooth curves intuitively represent trend progression. The 2-slide set offers varied color combinations ready for immediate use in business presentations and analytical reports.
Usage Points
-
Main Usage
Optimized for expressing cumulative trends of multiple data series over time. Perfect for comparing composite metrics like revenue, costs, and profit, or product-by-product and region-by-region cumulative performance. Simultaneously communicates overall scale changes and each series' contribution to the total.
-
How to Use
Use in business performance reports, marketing analysis presentations, and financial briefings to display period-by-period cumulative data. Modify area colors to distinguish categories and edit numeric labels to input actual data. The 5-point structure accommodates monthly, quarterly, or annual comparisons.
-
Recommended For
Finance teams, marketing professionals, and executives preparing performance reports. Ideal for business performance analysis presentations, investor briefings, quarterly and annual results reports, and product-line or channel-based revenue trend analysis. Suitable for any business presentation involving composite metrics.
-
Slide Structure
2-slide set featuring teal background with light blue and pink stacked areas, plus dark wine background variant with light blue and pink tones. Each slide includes 5 data points with numeric labels and legend, optimized for 16:9 widescreen format.
Related Products
-

Introduction to the Company's Business Areas – Cluster Design
#Company Introduction #Business Introduction #Diagram
-

Business Area Flower Diagram – Ideal for Company Introductions
#Company Introduction #Business Introduction #Diagram
-

Communication Business Area Diagram
#Company Introduction #Business Introduction #Diagram
-

Cooperative Partner Business Areas Diagram
#Company Introduction #Business Introduction #Diagram
