Weather-Based Temperature Analysis Diagram – Area Graph for Competitor Analysis
RJ0400013_10
- Last Update 05/20/2025
- File Size 0.8MB
- # of Slides 2
- File Format PPTX
- Slide Ratio 16:9
- Color
Keywords
- #Content-Based Slides
- #Design-Based Slides
- #Business Vision and Strategy
- #Marketing Plan and Strategy
- #Diagram
- #Business Strategy
- #Marketing Strategy
- #Flow
- #Spread
- #Multidirectional Flow
- #Radial Diagram
- #16:9
- #radial diagram PowerPoint
- #circular diagram slide template
- #hub and spoke diagram
- #competitive analysis PPT
- #comparison slide design
- #marketing strategy presentation
About the Product
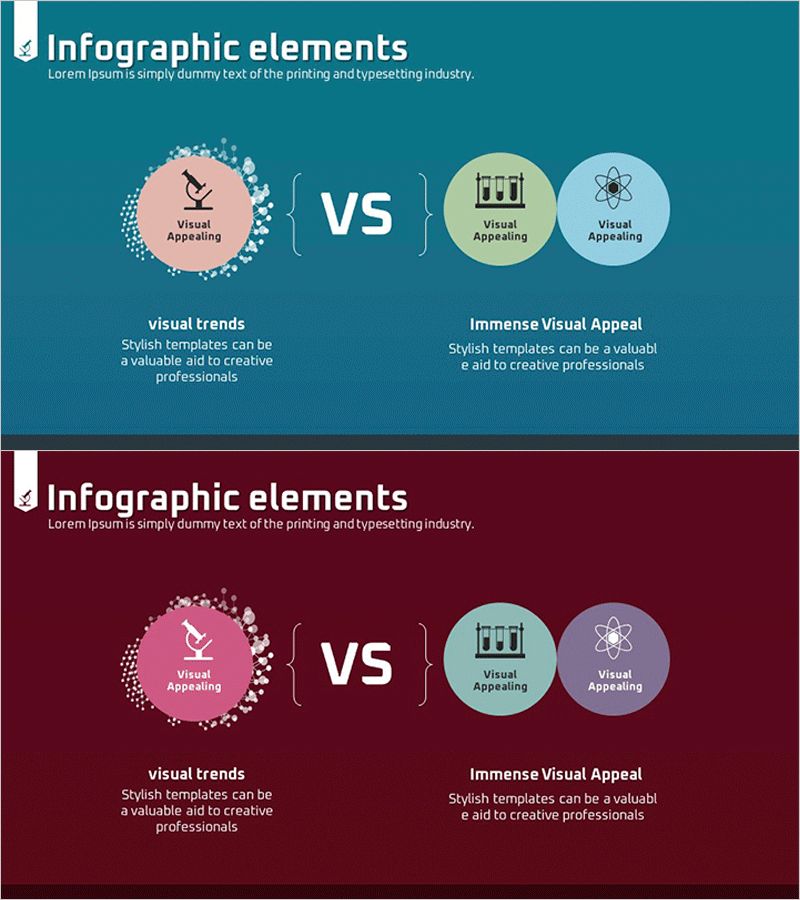
A radial diagram PowerPoint slide featuring a central concept connected to three surrounding elements in a circular arrangement. This presentation template is ideal for competitive analysis, strategic positioning, and market segmentation. The first slide uses a teal background with dispersed icons and text areas, while the second slide presents the same structure with a wine-colored background for visual comparison. With 2 slides in 16:9 format, this deck is ready to integrate into business presentations for data visualization, competitor benchmarking, temperature analysis, and strategic option comparison.
Usage Points
-
Main Usage
This slide is optimized for visually representing relationships between a core concept and related elements. The radial structure—with a central topic radiating to three surrounding items—effectively communicates comparative analysis, strategic planning, and positioning in business contexts.
-
How to Use
Enter your core topic and three comparison items on the first slide (teal background), then populate the second slide (wine background) with an alternative dataset using the same structure. Customize text and icons for competitive analysis, data comparison, market segmentation, or strategic option evaluation based on your presentation context.
-
Recommended For
Recommended for marketing, strategy, and sales professionals presenting competitive analysis, product positioning, and market segmentation strategies. Also valuable for data analysts, consultants, and business planners reporting comparative findings to executives.
-
Slide Structure
2-slide deck. Each slide features one central circular node (core topic) connected to three surrounding circular nodes (comparison items) via dotted connector lines. The first slide uses a teal background with dispersed icons; the second uses a wine background with identical structure, creating visual contrast for comparative effect.
Related Products
-

Medical Business Strategy Overlay Diagram
#Business Vision and Strategy #Marketing Plan and Strategy #Diagram
-

Marketing Strategy Arrow Diagram – Illustrating Business Flow
#Business Vision and Strategy #Marketing Plan and Strategy #Diagram
-

Pathway to Logistics Growth with Upward Arrows
#Business Vision and Strategy #Marketing Plan and Strategy #Diagram
-

Circle Diagram Emphasizing Visual Appeal – A Slide that Shines in Design and Quality
#Business Vision and Strategy #Marketing Plan and Strategy #Diagram
