Weather Analysis Table – Market Analysis and Business Strategy
RJ0400013_12
- Last Update 05/20/2025
- File Size 0.8MB
- # of Slides 2
- File Format PPTX
- Slide Ratio 16:9
- Color
Keywords
- #Content-Based Slides
- #Design-Based Slides
- #Business Vision and Strategy
- #Market and Competitor Analysis
- #Diagram
- #Business Goals
- #Market Analysis
- #Table
- #Standard Table
- #16:9
- #radial diagram PowerPoint
- #hub-and-spoke diagram slide
- #3-item concept map
- #business relationship diagram PowerPoint
- #how to create radial diagram in PowerPoint
About the Product
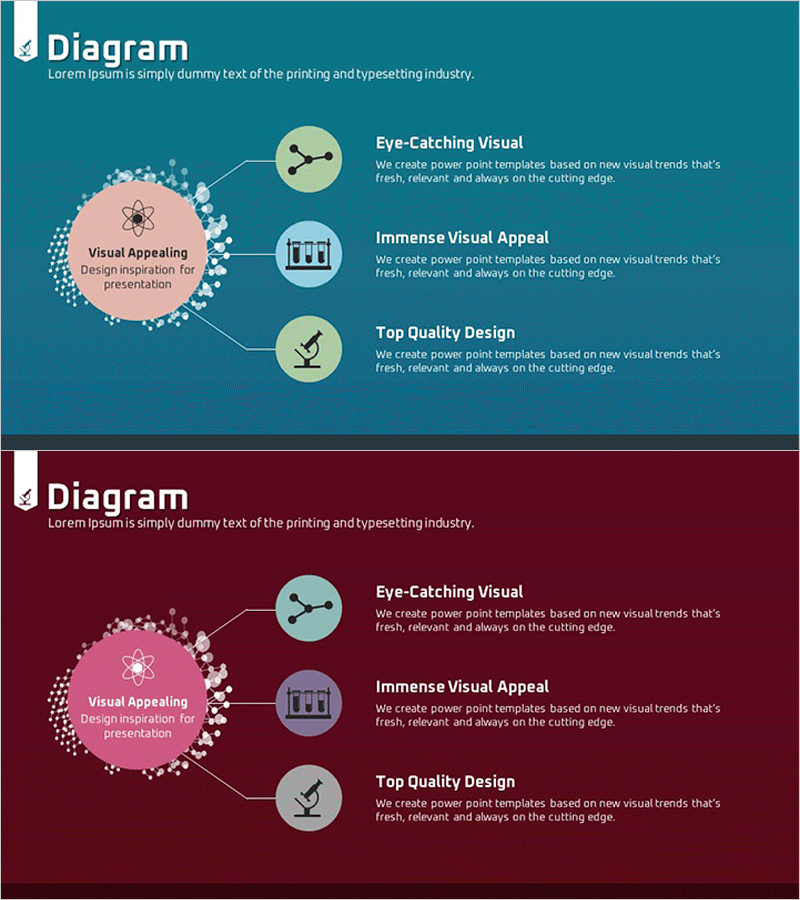
A radial diagram PowerPoint slide with a central concept radiating to three connected elements. Features a teal background with a pink central circle and three circular nodes linked by connector lines, each with icons and text areas for core message and supporting details. Includes two color variations (teal and burgundy) across 2 slides in 16:9 widescreen PPTX format. Instantly editable for visualizing concept relationships, strategic pillars, business values, or key differentiators in presentations.
Usage Points
-
Main Usage
Visually represents a central concept or strategy with three key supporting elements radiating outward. Ideal for illustrating business models, core values, strategic pillars, product features, or service components. Clarifies center-to-periphery relationships and enhances audience comprehension of interconnected ideas.
-
How to Use
Enter the core concept in the central pink circle. Add item names and descriptions in the three outer nodes. Replace icons to match each element's characteristics. Switch between teal and burgundy background versions to differentiate sections or create visual variety across slides.
-
Recommended For
Executive summaries, strategy presentations, product launches, marketing plans, business proposals, and consulting reports. Effective for highlighting core values, strategic pillars, competitive advantages, organizational restructuring, or new business initiatives.
-
Slide Structure
Central pink circle (text input area) connected via three lines to three outer circular nodes (each with icon and text input area). Two color variations provided: teal background and burgundy background. Optimized for 16:9 widescreen format.
Related Products
-

Table Design for Information Transfer – Emphasizing Visual Appeal
#Business Vision and Strategy #Market and Competitor Analysis #Diagram
-

Sales & Performance Status Slide – Data-Driven Insights
#Company Introduction #Market and Competitor Analysis #Diagram
-

Cement Theme Bar Graph & Table
#Market and Competitor Analysis #Diagram #Graph
-

Infographic Design Wide Template Map&Table
#Market and Competitor Analysis #Financial Plans and Performance #Diagram
