Science Business Goals Connection Diagram – Vision and Strategy
RJ0400013_25
- Last Update 05/20/2025
- File Size 0.4MB
- # of Slides 2
- File Format PPTX
- Slide Ratio 16:9
- Color
Keywords
- #Content-Based Slides
- #Design-Based Slides
- #Business Vision and Strategy
- #Business Strategy
- #Diagram
- #Business Goals
- #Cluster
- #Chain Diagram
- #Project Progress
- #16:9
- #circular process diagram PowerPoint
- #4-step process slide template
- #business goals presentation
- #strategy flow diagram
- #process flow PowerPoint slide
About the Product
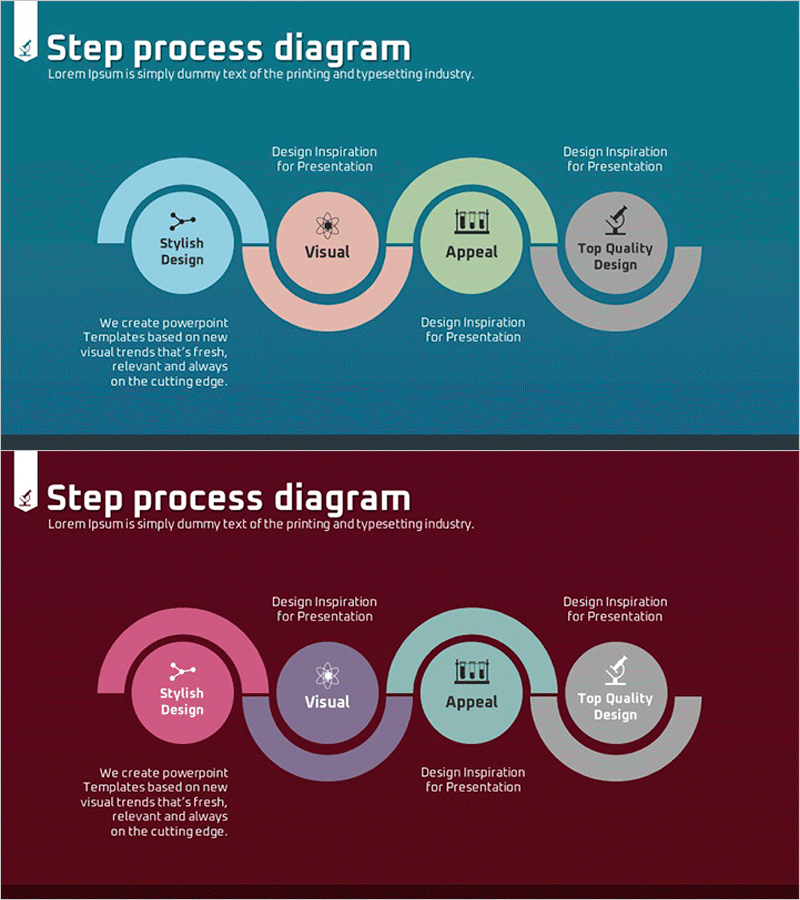
A 4-step circular process diagram PowerPoint slide that connects business objectives, vision, and strategic goals in sequential flow. Set against a teal background with pastel-colored circular nodes (Stylish Design, Visual, Appeal, Top Quality Design), each step is linked by directional arrows to clarify progression. The 2-slide set presents the identical diagram in both teal and wine backgrounds, allowing you to select based on presentation context and brand colors. This PowerPoint slide template is optimized for explaining business implementation progress, vision and strategy development, and goal achievement processes.
Usage Points
-
Main Usage
Visualize a 4-step circular process for achieving business objectives, clarifying the connection between vision, strategy, execution, and evaluation. Each stage is represented as a circular node highlighting core elements (Stylish Design, Visual, Appeal, Top Quality Design), emphasizing a balanced and integrated structure.
-
How to Use
Use in business plan presentations, strategy development meetings, and organizational goal-sharing sessions. Edit the text and icons within each circular node to customize with your organization's specific objectives, strategies, and action items. Select the teal background to emphasize trust and stability, or the wine background to convey premium quality and professionalism.
-
Recommended For
Ideal for executives, business planning teams, strategy managers, and project leaders presenting organizational objectives and implementation roadmaps. Particularly effective in science, technology, manufacturing, finance, and consulting industries where systematic process management is critical.
-
Slide Structure
Four circular nodes arranged clockwise, each distinguished by icon, text, and background color. Directional arrows between nodes express the circular flow. Explanatory text area positioned in the lower left. Both slides maintain identical structure with background colors varying between teal (top) and wine (bottom).
Related Products
-

Medical Business Goal Connection Diagram - Business Strategy
#Business Vision and Strategy #Business Strategy #Diagram
-

Medical Business Goals Connection Diagram - Intuitive Representation of Vision and Strategy
#Business Vision and Strategy #Business Strategy #Diagram
-

Diagram of Space Industry Progress
#Business Vision and Strategy #Business Strategy #Diagram
-

Blue Pink Business Goals Connection Diagram
#Business Vision and Strategy #Business Strategy #Diagram
