Diffusion Diagram of Scientific Fields – Innovation and Connection
RJ0400013_32
- Last Update 05/21/2025
- File Size 0.4MB
- # of Slides 2
- File Format PPTX
- Slide Ratio 16:9
- Color
Keywords
- #Content-Based Slides
- #Design-Based Slides
- #Business Introduction
- #Diagram
- #Infrastructure
- #Flow
- #Multidirectional Flow
- #16:9
- #radial diagram PowerPoint
- #diffusion diagram slide
- #scientific diagram template
- #node connection PPT
- #information structure diagram
- #innovation network presentation
- #how to create diffusion diagram in PowerPoint
About the Product
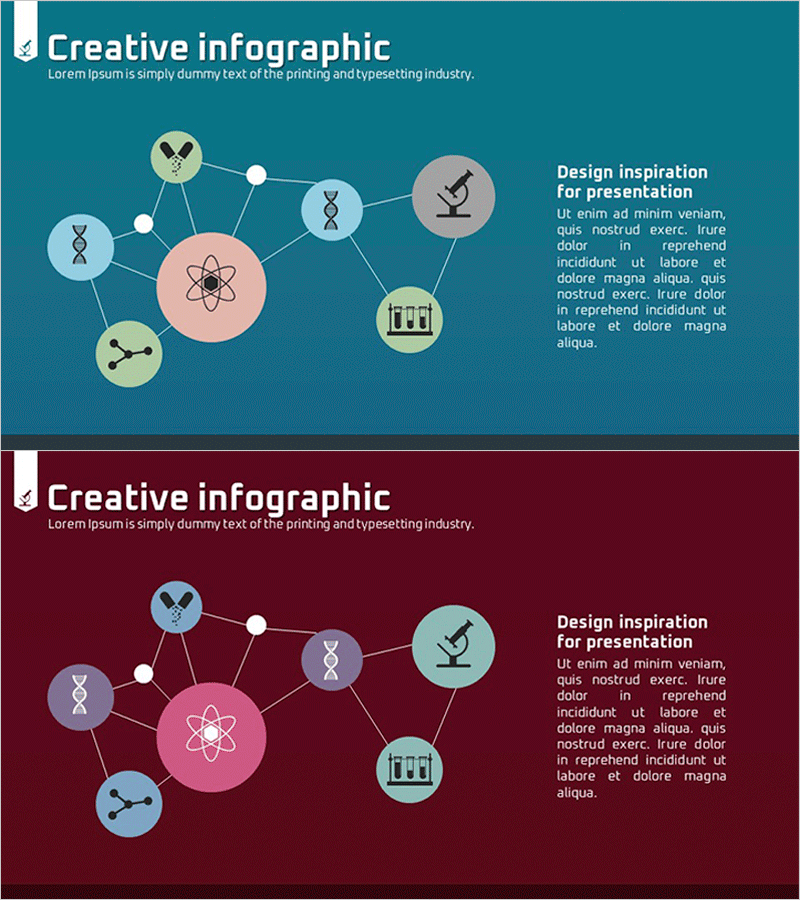
A radial diffusion diagram PowerPoint slide that visualizes innovation and connectivity in scientific fields. The structure extends from a central circular node outward to six directional nodes, intuitively expressing the relationship between core concepts and peripheral elements. Set against a teal background with pink, lime, and gray nodes paired with scientific icons (DNA, atom, microscope, test tube, molecular structure), it reinforces academic credibility. Provided in two color variations (teal and wine red), each node supports text input and allows free editing of icons and colors. Ideal for presentations, reports, and educational materials emphasizing information flow and interconnectedness.
Usage Points
-
Main Usage
Expresses scientific innovation concepts, technology diffusion, and network connectivity through a radial structure extending from central core to periphery. Transforms complex information systems into simple, intuitive visuals that enhance audience comprehension.
-
How to Use
Use in opening slides to explain relationships between core concepts and related elements. Customize by entering text in each node and modifying colors and icons to fit various industries and diffusion structures.
-
Recommended For
Science and technology presentations, product innovation strategy explanations, technology diffusion pathway analysis, organizational network structure descriptions, academic seminars, educational materials, and consulting reports' conceptual sections.
-
Slide Structure
One large central circular node (pink) plus six surrounding nodes (lime, gray, sky blue tones) connected by white dotted lines. Includes scientific icons (DNA, atom, microscope, test tube, molecule, gene). Two-slide set with teal and wine red background variations.
Related Products
-

Business Infrastructure Diagram – Effective Resource Navigation
#Business Introduction #Technical Approach #Diagram
-

Business Infrastructure Multidirectional Diagram – Strategic Flow Representation
#Business Introduction #Diagram #Business Areas
-

Medical Product Differentiation Strategy Diagram – Growth Through Information Sharing and Collaboration
#Product/Service Introduction #Diagram #Differentiation Strategy for Products/Services
-

Setting Business Goals – Intuitive Flow Diagram
#Product/Service Introduction #Business Vision and Strategy #Diagram
