Vertical Bar Graph for Market Analysis – Weathercaster Profile
RJ0400013_6
- Last Update 05/21/2025
- File Size 0.4MB
- # of Slides 2
- File Format PPTX
- Slide Ratio 16:9
- Color
Keywords
- #Content-Based Slides
- #Design-Based Slides
- #Company Introduction
- #Market and Competitor Analysis
- #Diagram
- #Introduction of Executives
- #Customer Analysis
- #Cluster
- #Closed Cluster Diagram
- #16:9
- #circular diagram PowerPoint slide
- #5-step cycle diagram
- #process flow PowerPoint template
- #circular node slide design
- #how to create cycle diagram in PowerPoint
About the Product
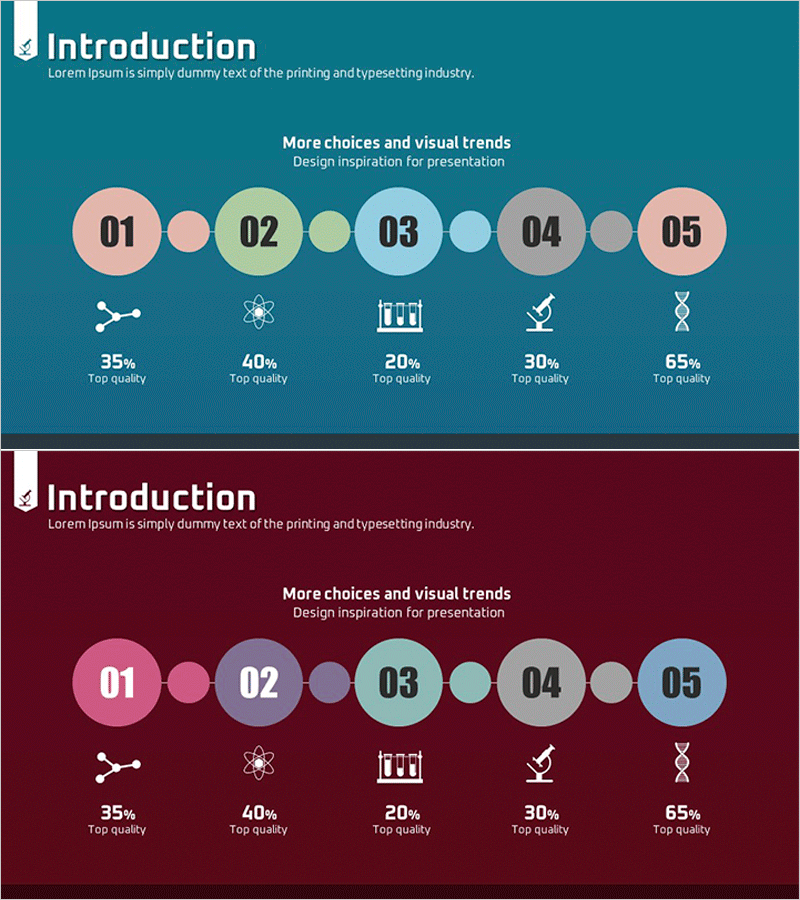
A 5-step circular diagram PowerPoint slide featuring interconnected nodes in pink, sage green, light blue, gray, and coral tones on a teal background. Each stage displays an icon and percentage data below, creating a clear visual flow for process cycles and sequential progression. Ideal for marketing, strategy, and operational presentations requiring visual representation of recurring workflows. The 2-slide set includes both teal and wine-red background options, allowing flexible customization to match your presentation theme and brand identity.
Usage Points
-
Main Usage
Visualizes 5-stage circular processes, cycles, and recurring workflows. Suitable for marketing funnels, product development stages, customer journey mapping, operational processes, and strategic execution phases where cyclical flow representation is essential.
-
How to Use
Edit each circular node with stage names, department titles, or role descriptions. Replace icons and percentage values to match your presentation context. Choose between teal or wine-red background options to align with corporate branding and presentation theme.
-
Recommended For
Marketing, sales, strategy, operations, HR, and product development professionals presenting process improvements, cycle explanations, and progress tracking. Effective for executive briefings, team meetings, client presentations, and training seminars requiring clear communication of complex workflows.
-
Slide Structure
Five primary circular nodes of varying sizes connected in clockwise arrangement with four smaller connector circles. Each node includes an icon (line graph, atom, building, microscope, DNA) and percentage data (35%, 40%, 20%, 30%, 65%) positioned below. Title and subtitle areas occupy the upper section.
Related Products
-

Expert Profiles Overview at a Glance
#Market and Competitor Analysis #Customer Success Stories #Diagram
-

Customer Persona and Segmentation Analysis Diagram – Summarizing Market Share
#Market and Competitor Analysis #Diagram #Customer Analysis
-

Responsible Team Profile Slide
#Company Introduction #Market and Competitor Analysis #Diagram
-

Clothing Site Customer Analysis Graph – Business Growth Through Customer Insights
#Market and Competitor Analysis #Diagram #Graph
