Idea Presentation Wide – Stylish Business Design
J0300066
- Last Update 07/14/2025
- File Size 8MB
- # of Slides 30
- File Format PPTX
- Slide Ratio 16:9
- Color
Slide Preview

Keywords
About the Product
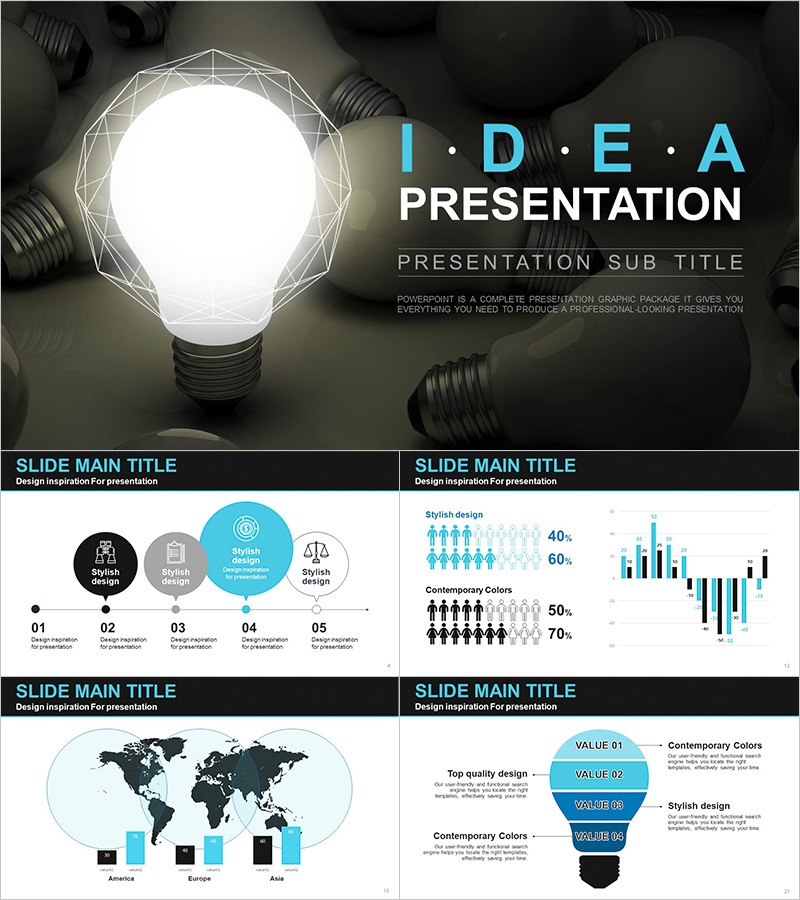
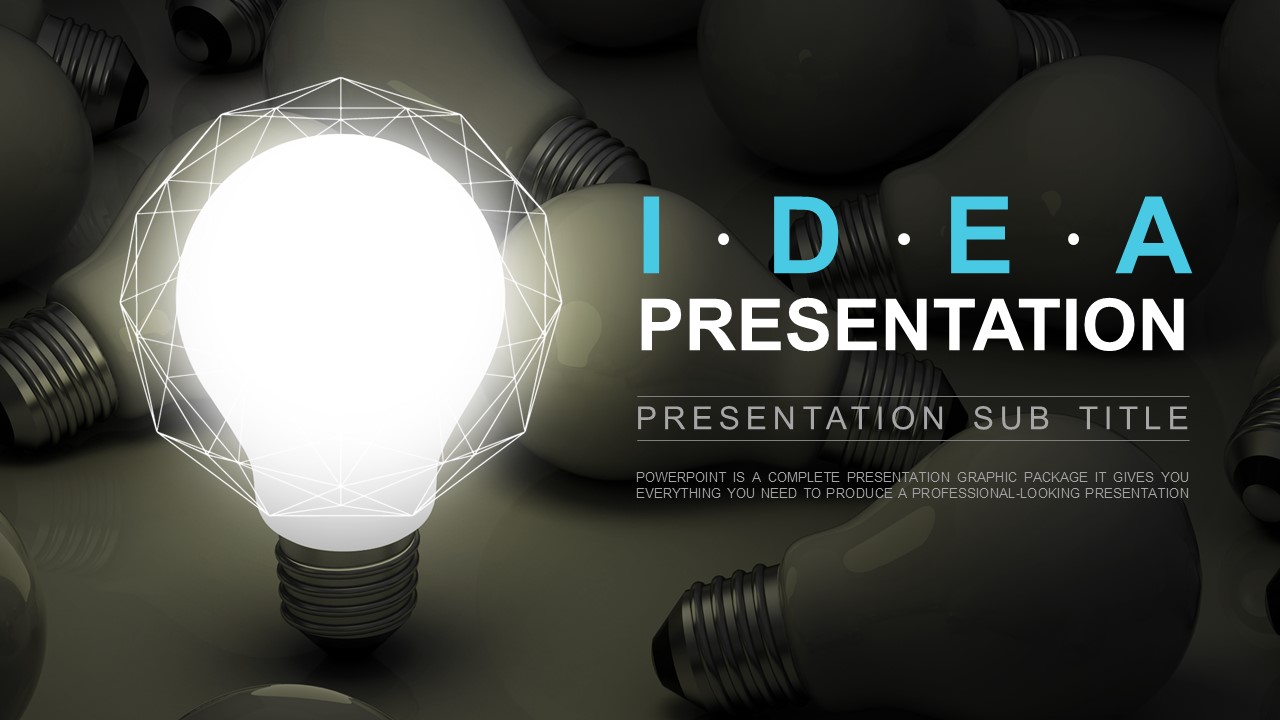
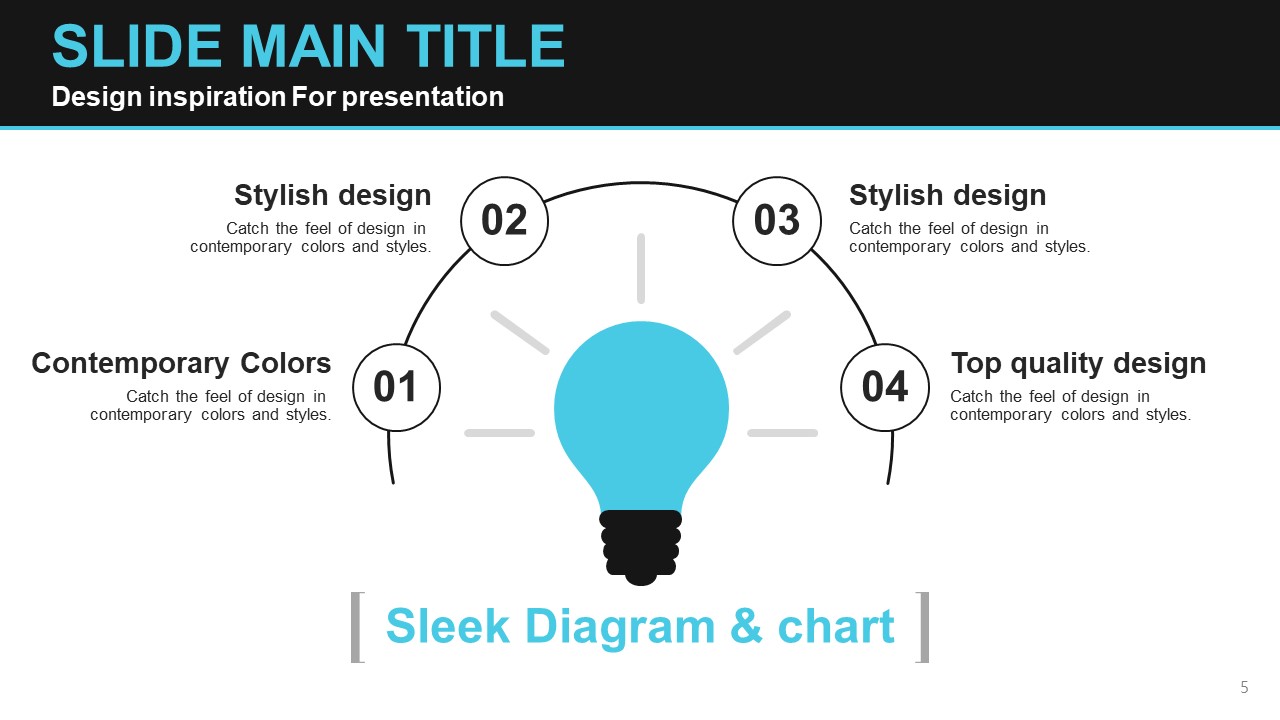
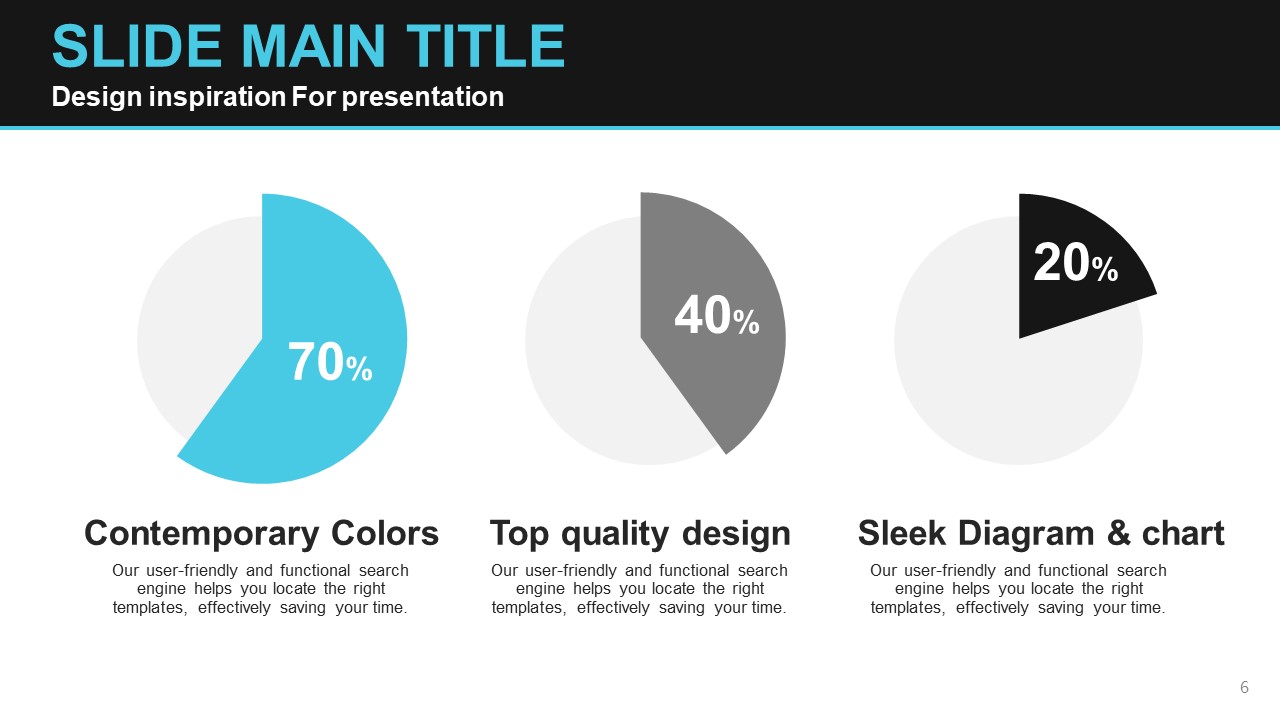
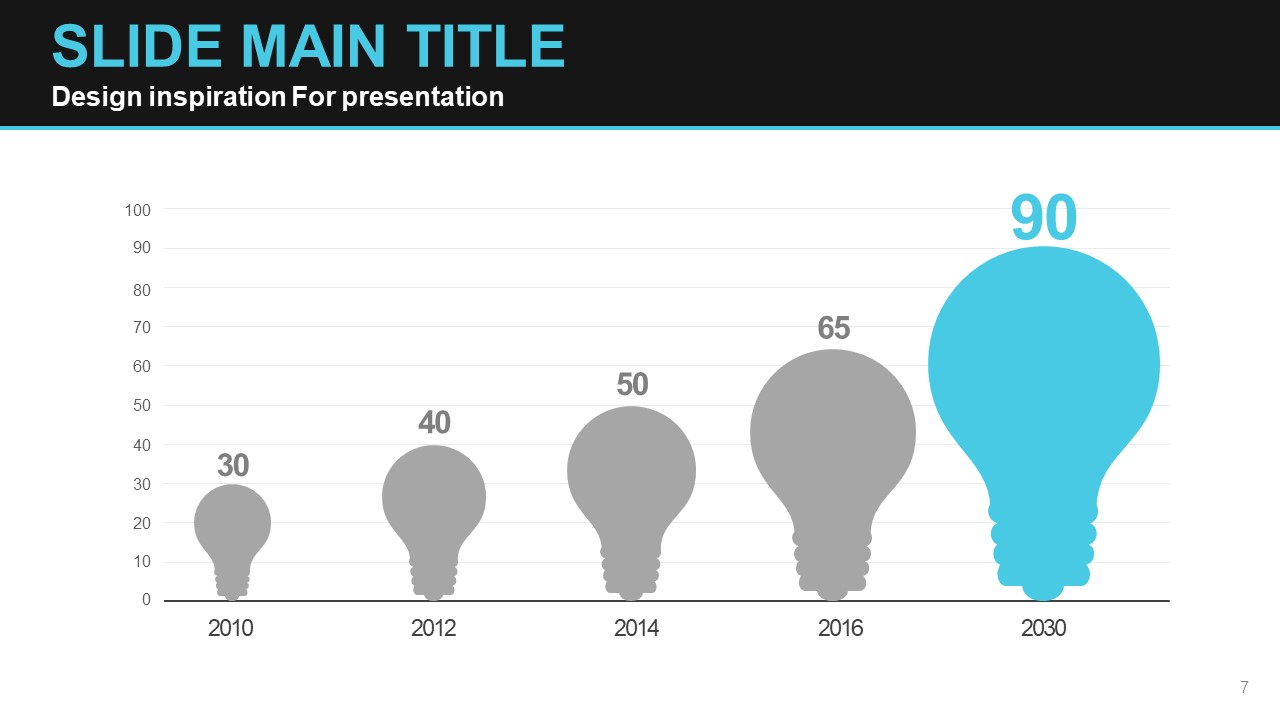
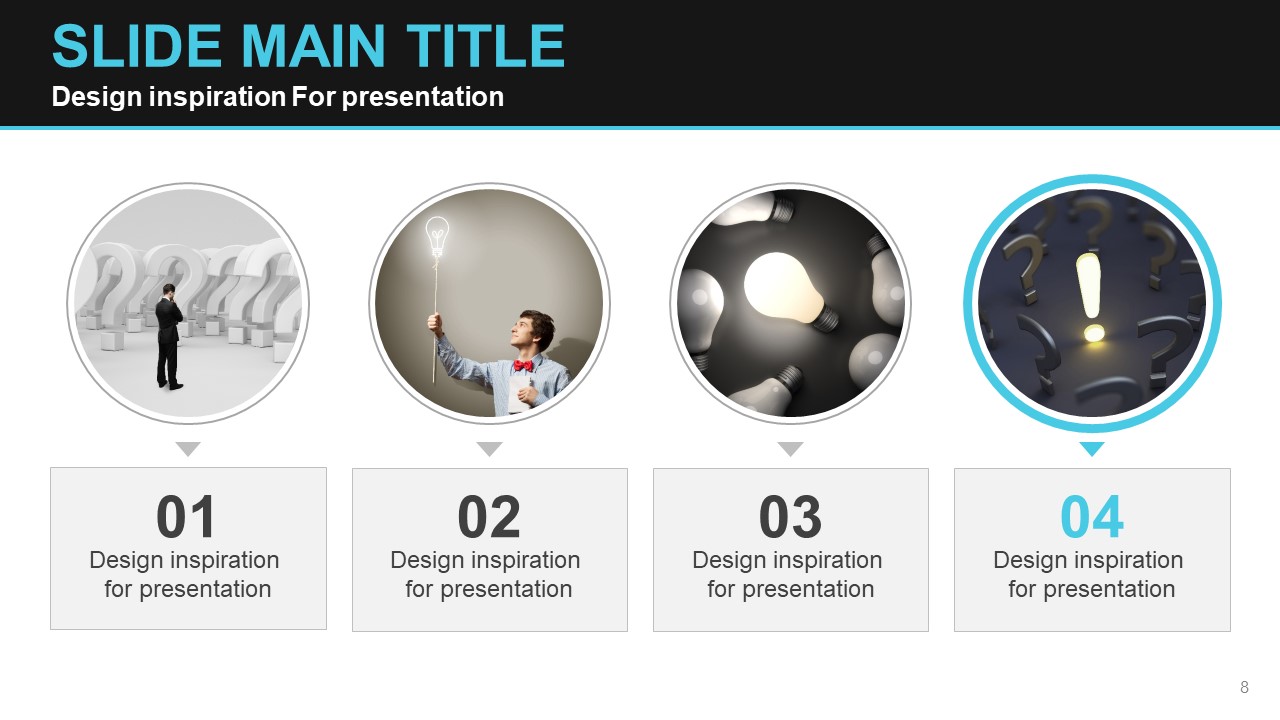
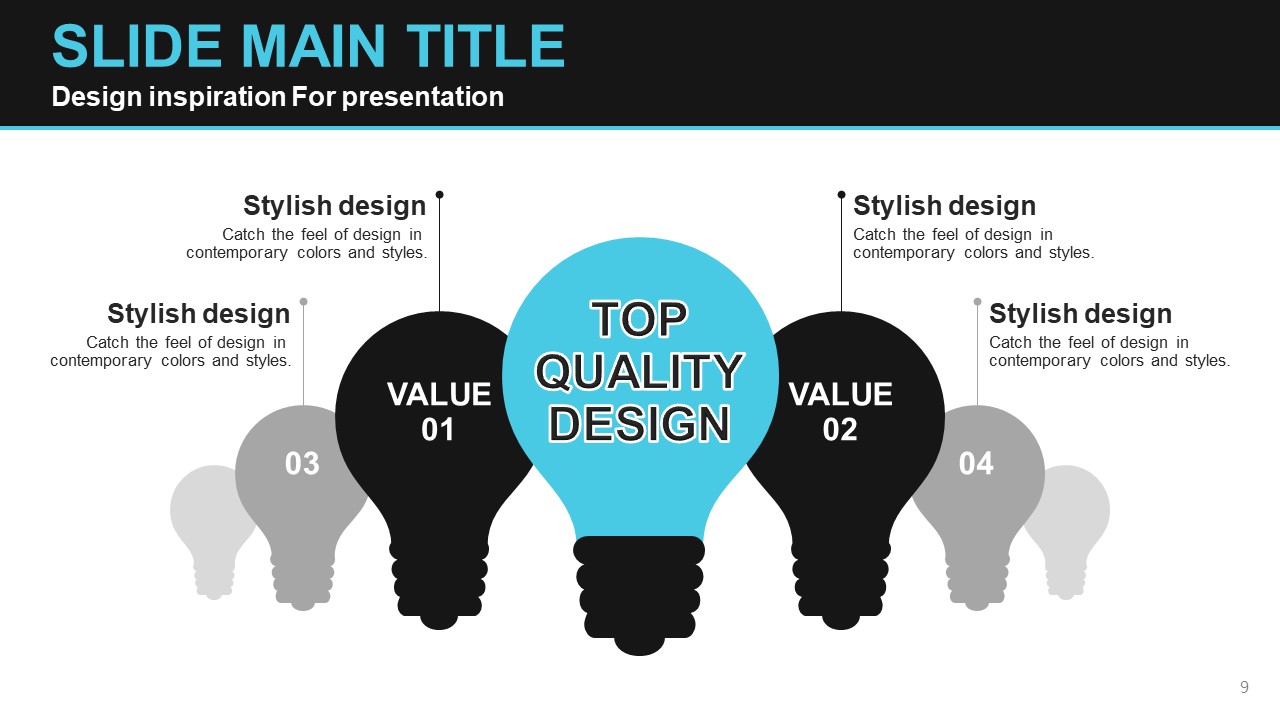
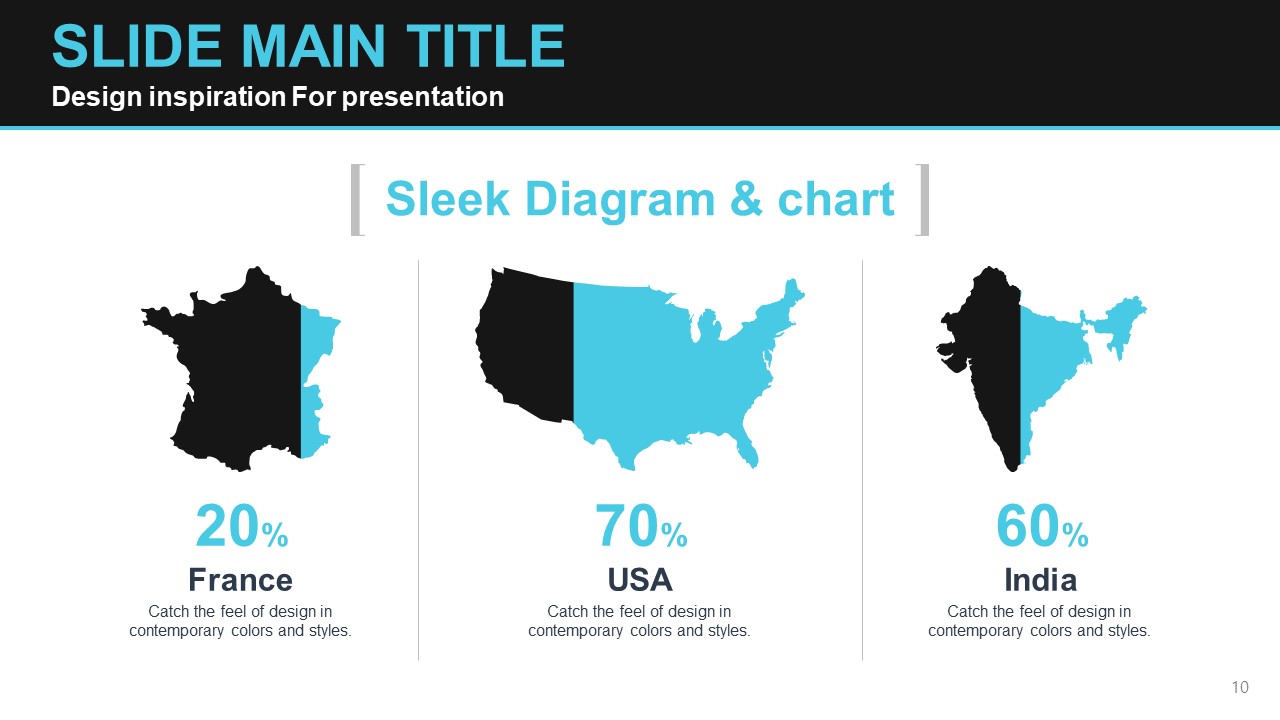
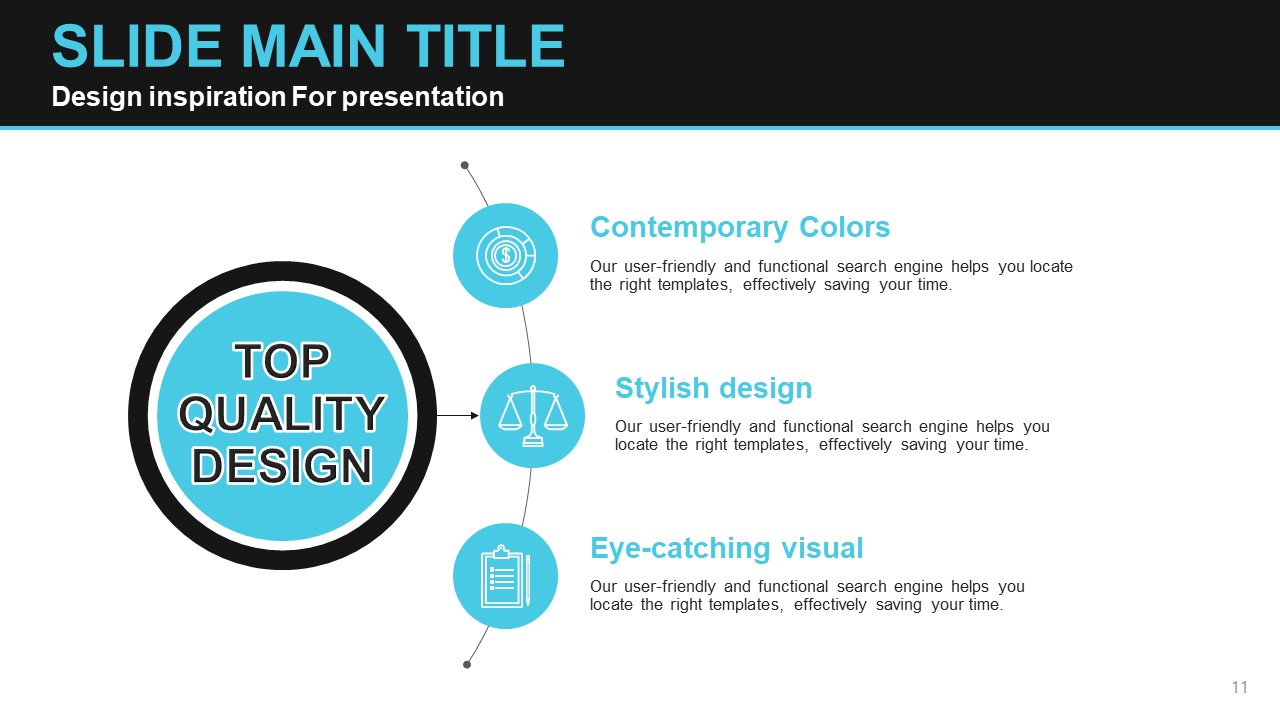
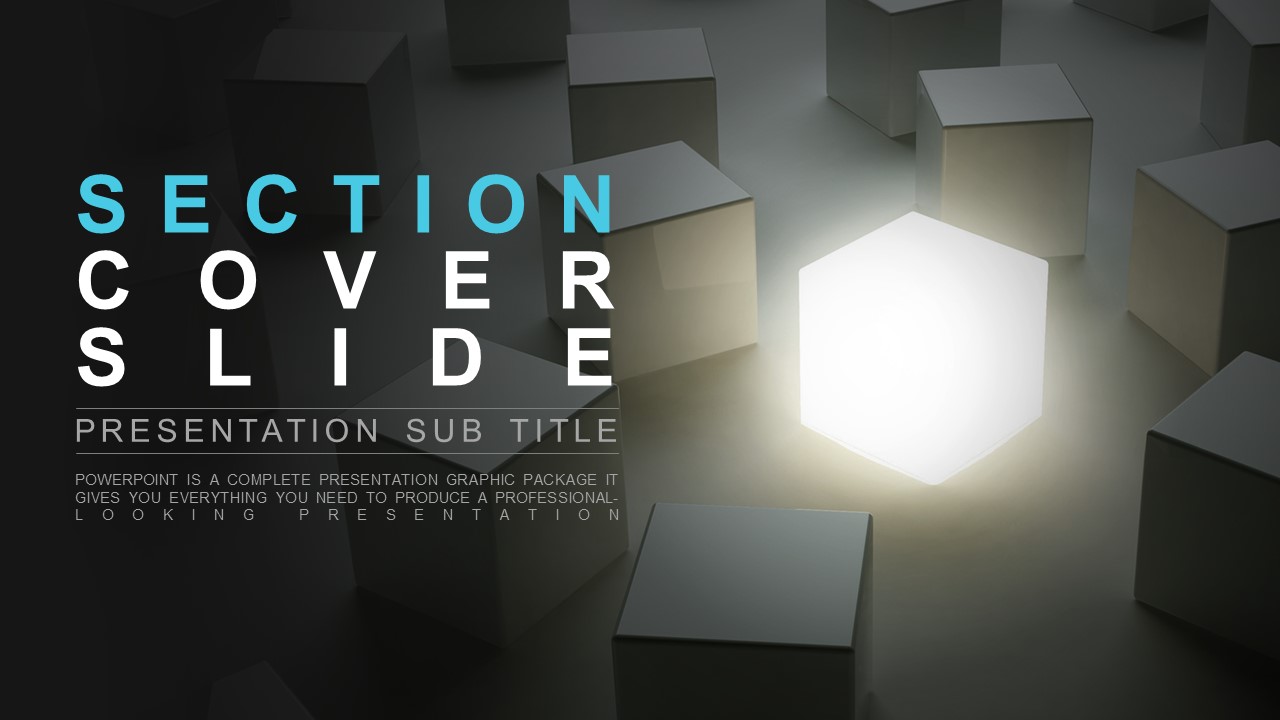
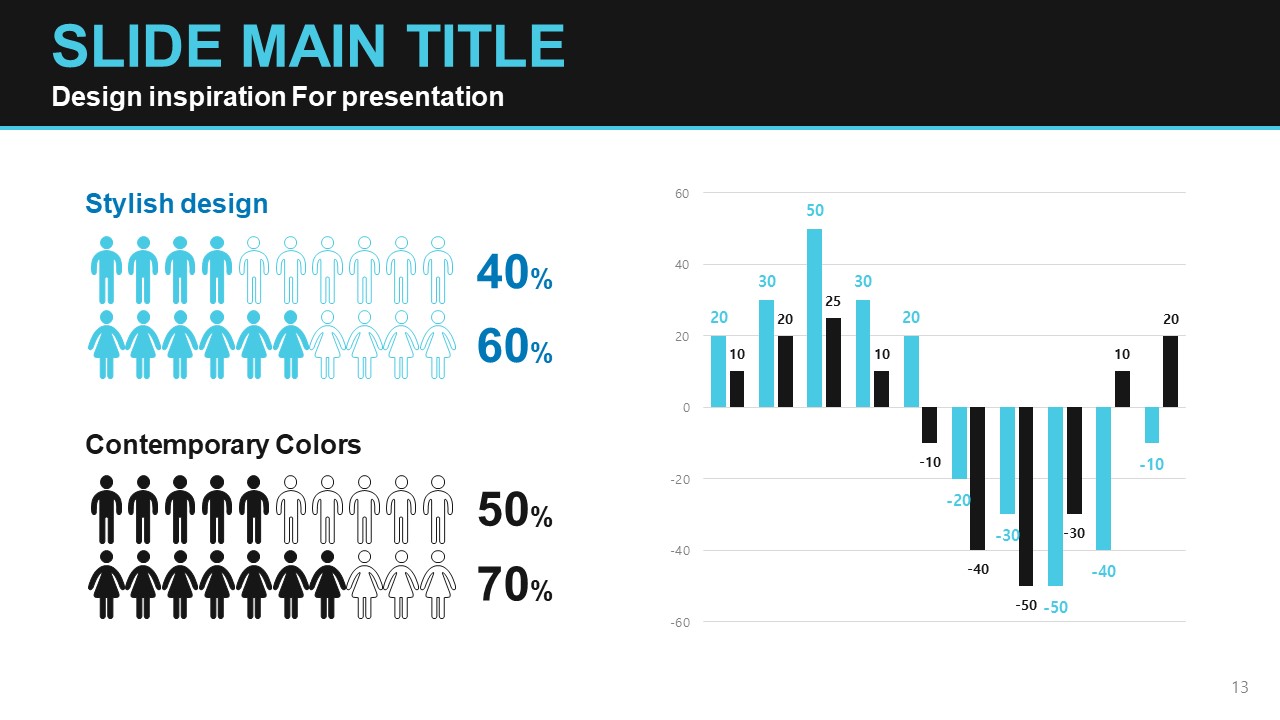
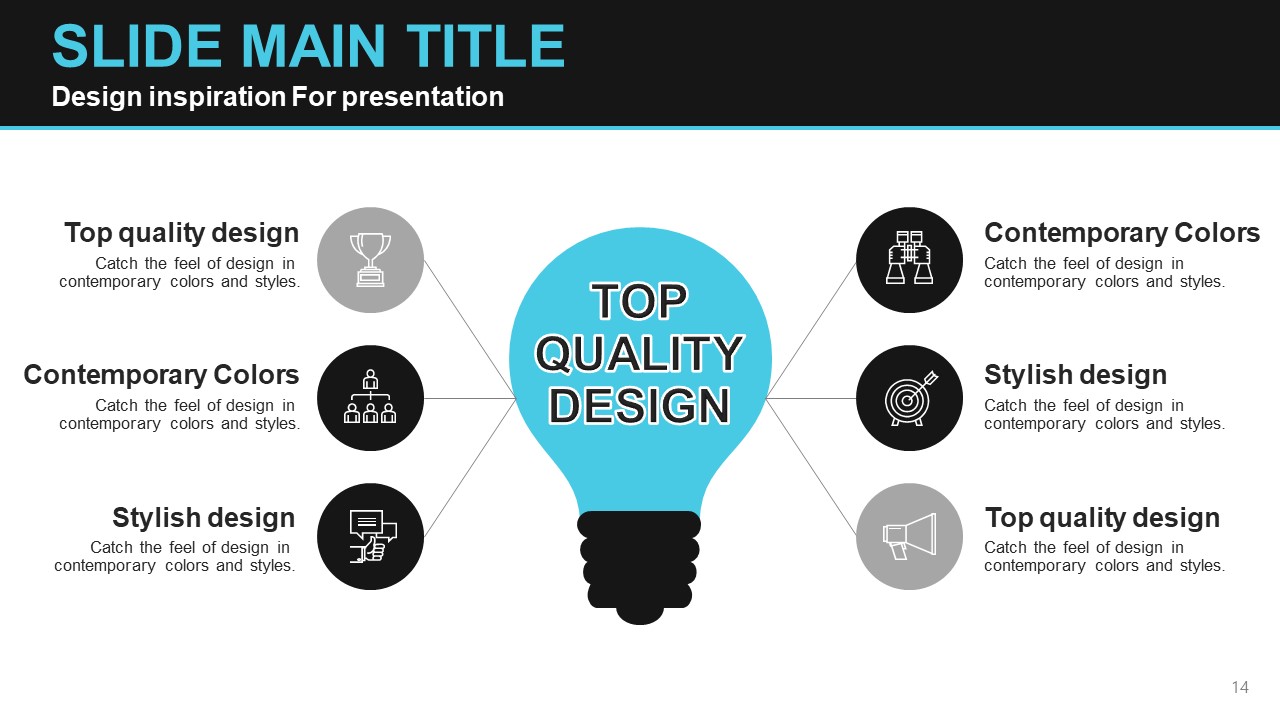
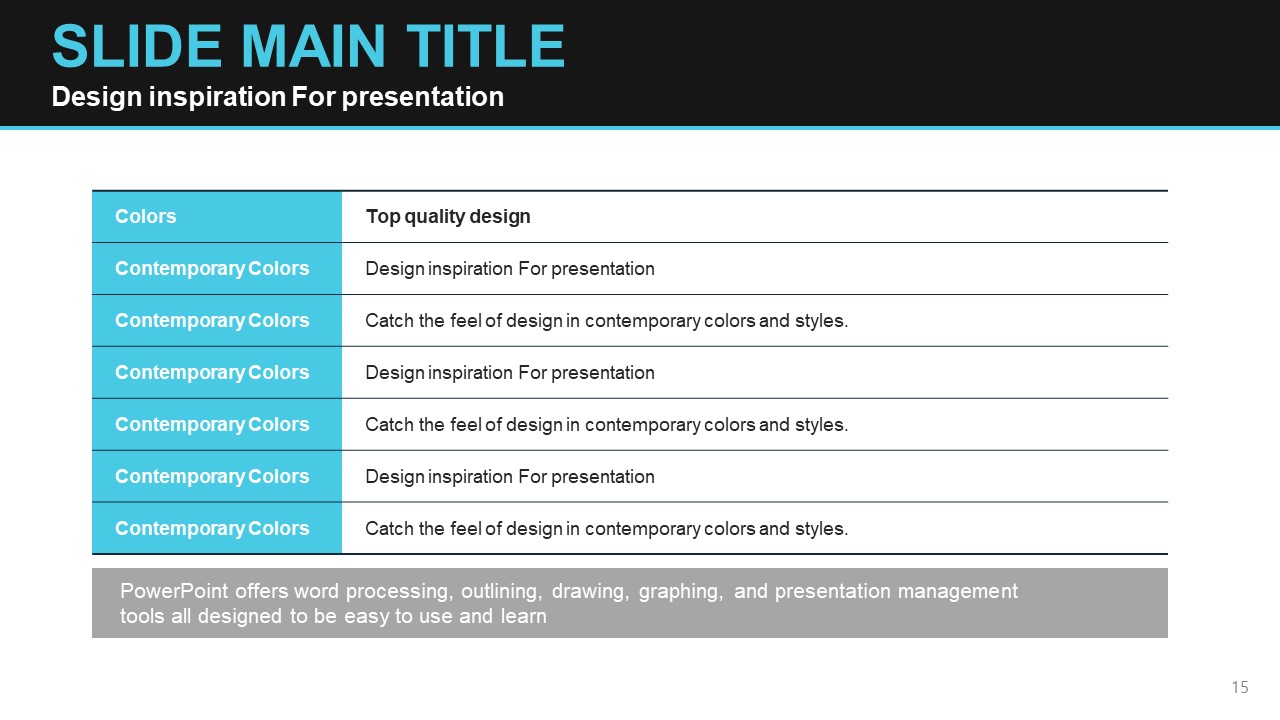
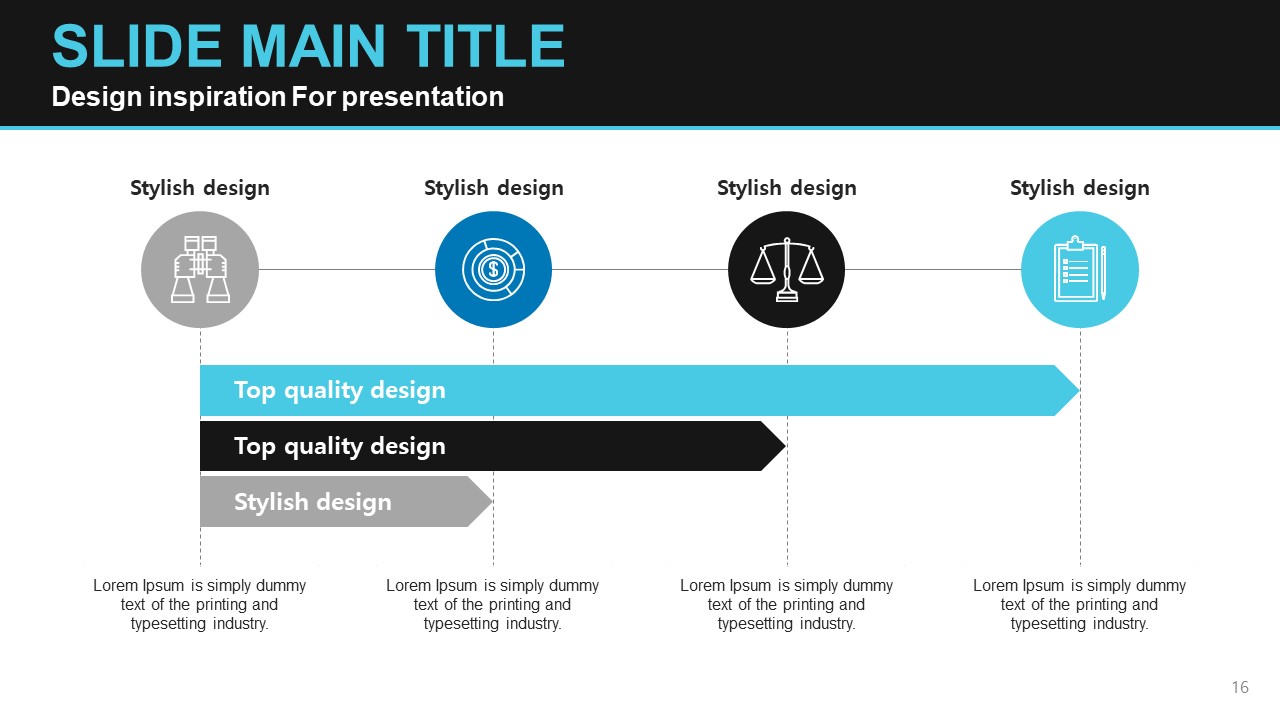
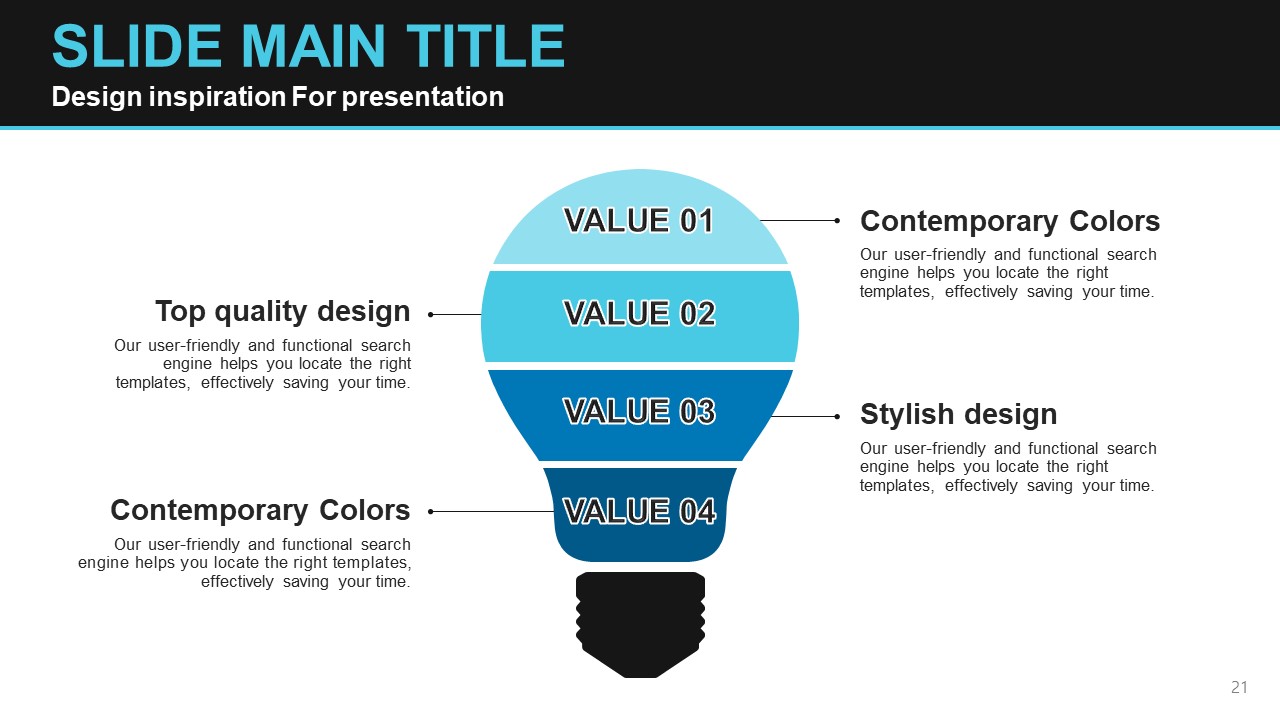
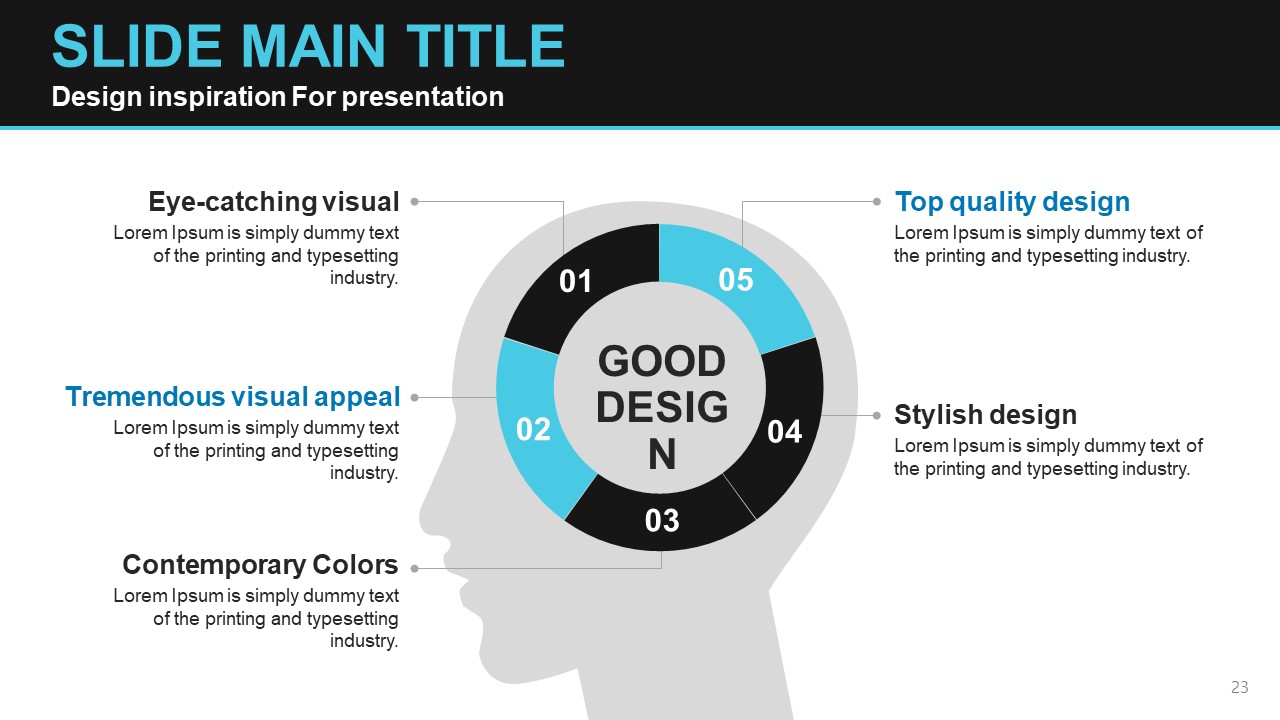
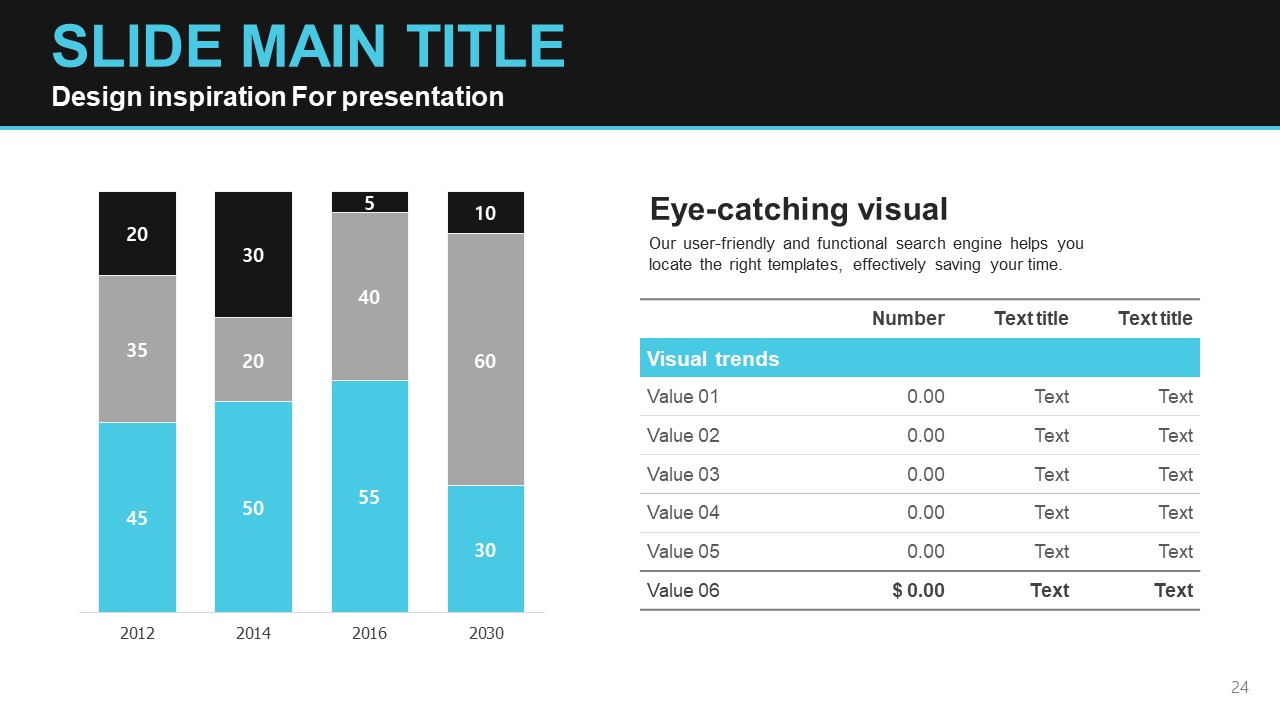
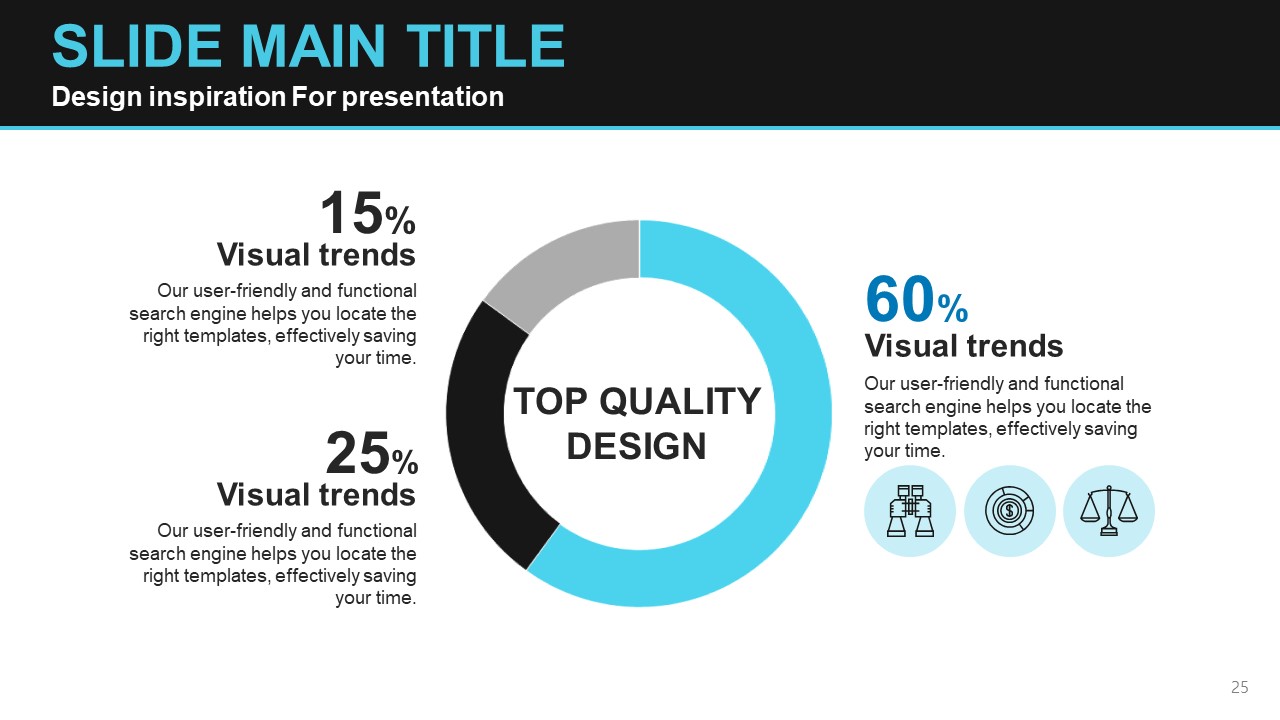
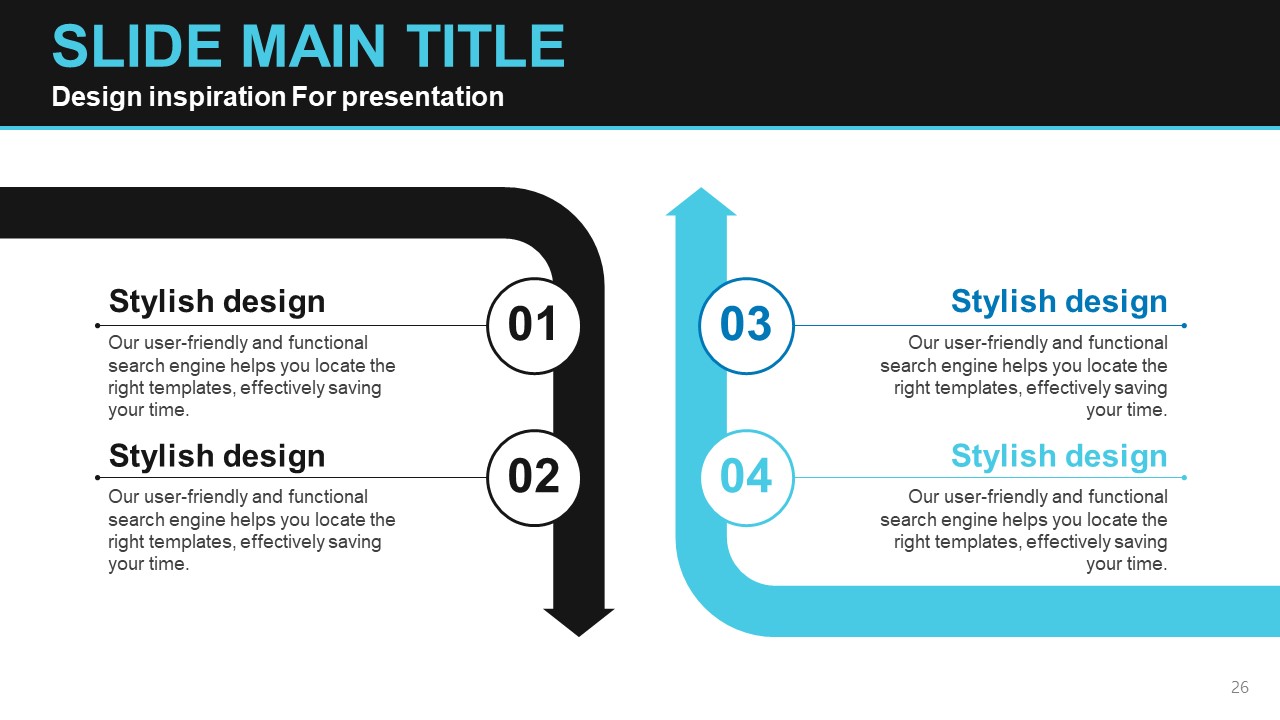
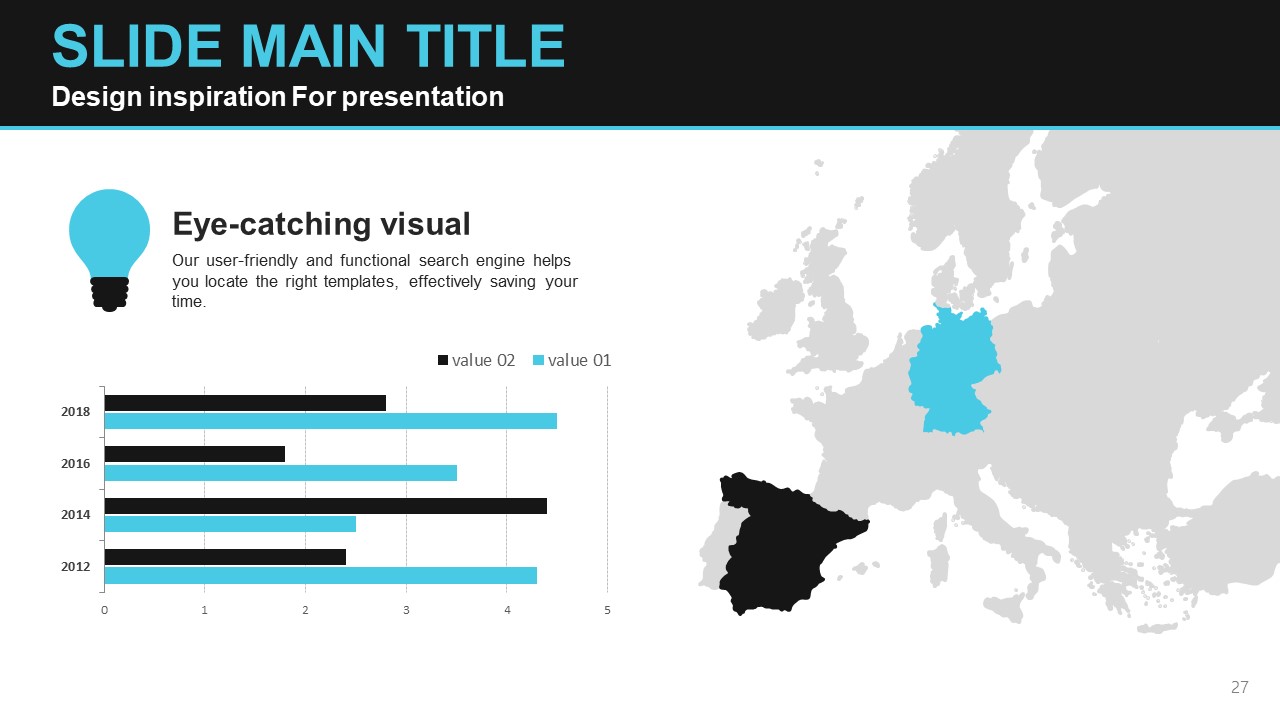
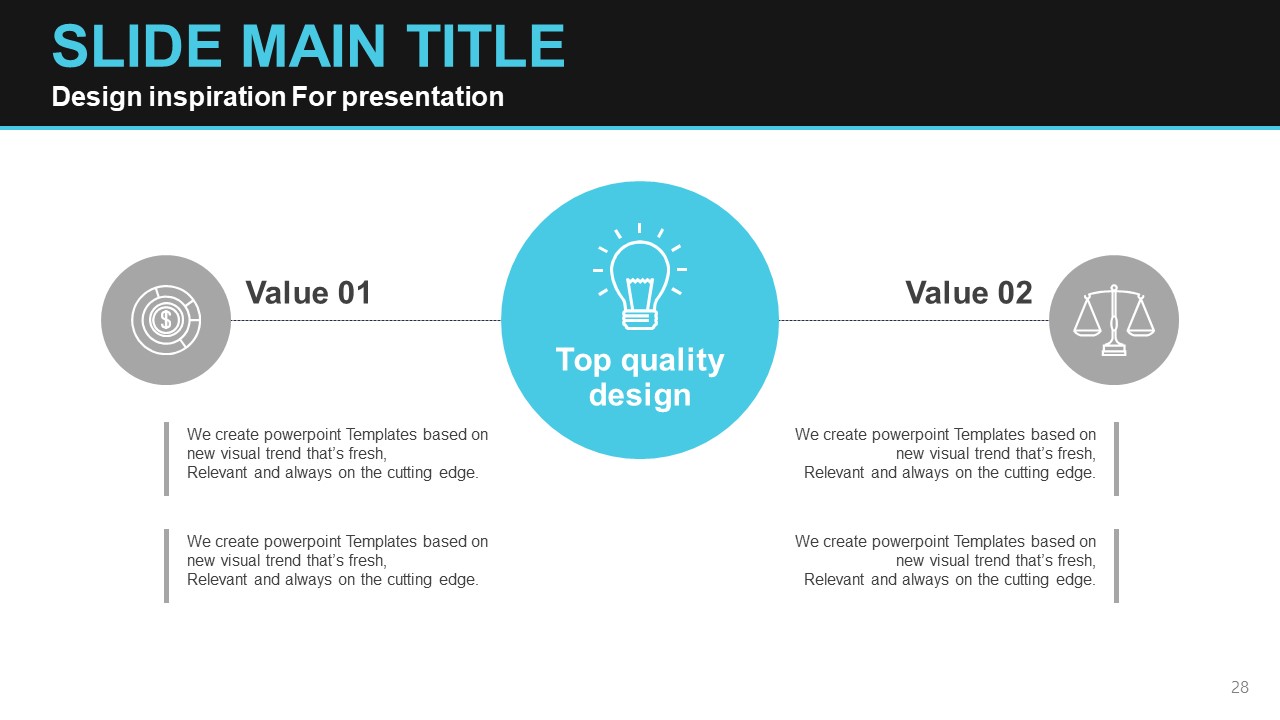
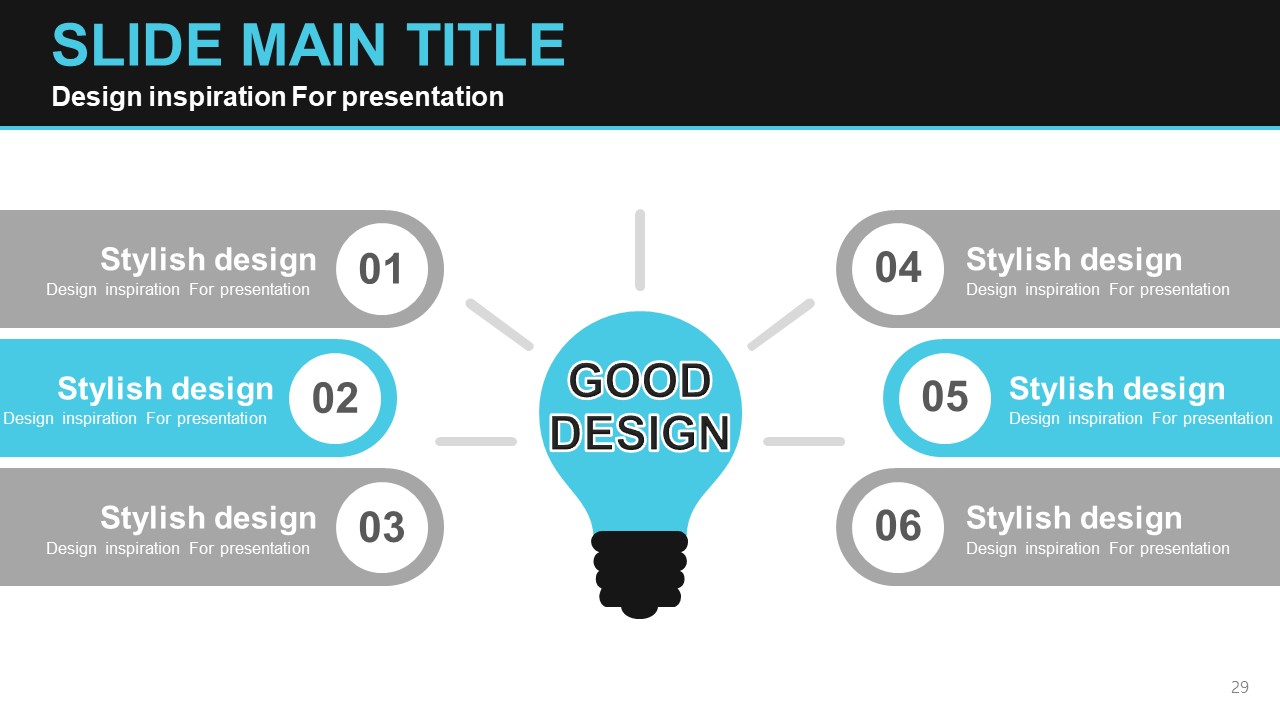
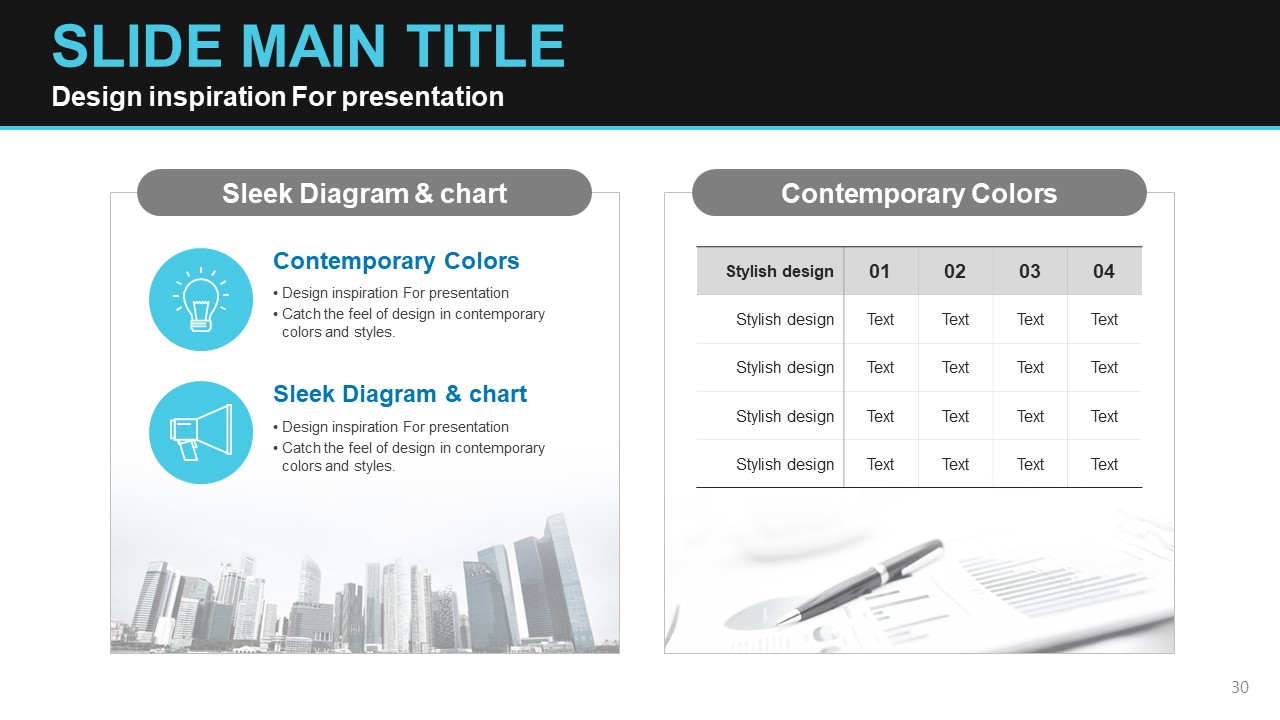
A high-contrast business PowerPoint template featuring a dark black background with cyan blue accent colors, built around a glowing light bulb motif. This 30-slide presentation deck is designed for idea pitches, innovation strategies, and business planning presentations. Slides include a 5-step process diagram, pictogram infographics, bar charts with percentage data, a world map data slide, a radial icon diagram, a donut chart with silhouette layout, and a multi-bulb comparison slide. All elements are fully editable in PPTX format, allowing you to customize text, colors, and shapes to match your brand. Ideal for startup pitching, new business proposals, and marketing strategy presentations where visual impact is essential. Whether you call it a slide deck, presentation, or PowerPoint, this template delivers a professional and memorable look for any high-stakes business scenario.
Usage Points
-
Main Usage
Designed for idea pitches, innovation strategy presentations, and new business proposals. The dark black and cyan color scheme creates strong visual impact, making it ideal for startup pitching sessions, investor meetings, and executive-level business presentations.
-
How to Use
Open the PPTX file and replace placeholder text, data, and visuals with your own content. Mix and match the process diagrams, infographic slides, and chart layouts to build a presentation flow that fits your story and audience.
-
Recommended For
Best suited for startup founders, strategy and planning teams, marketers, and consultants who need to deliver ideas and strategies with strong visual impact. Also effective for investor pitches, executive briefings, and innovation workshops.
-
Slide Structure
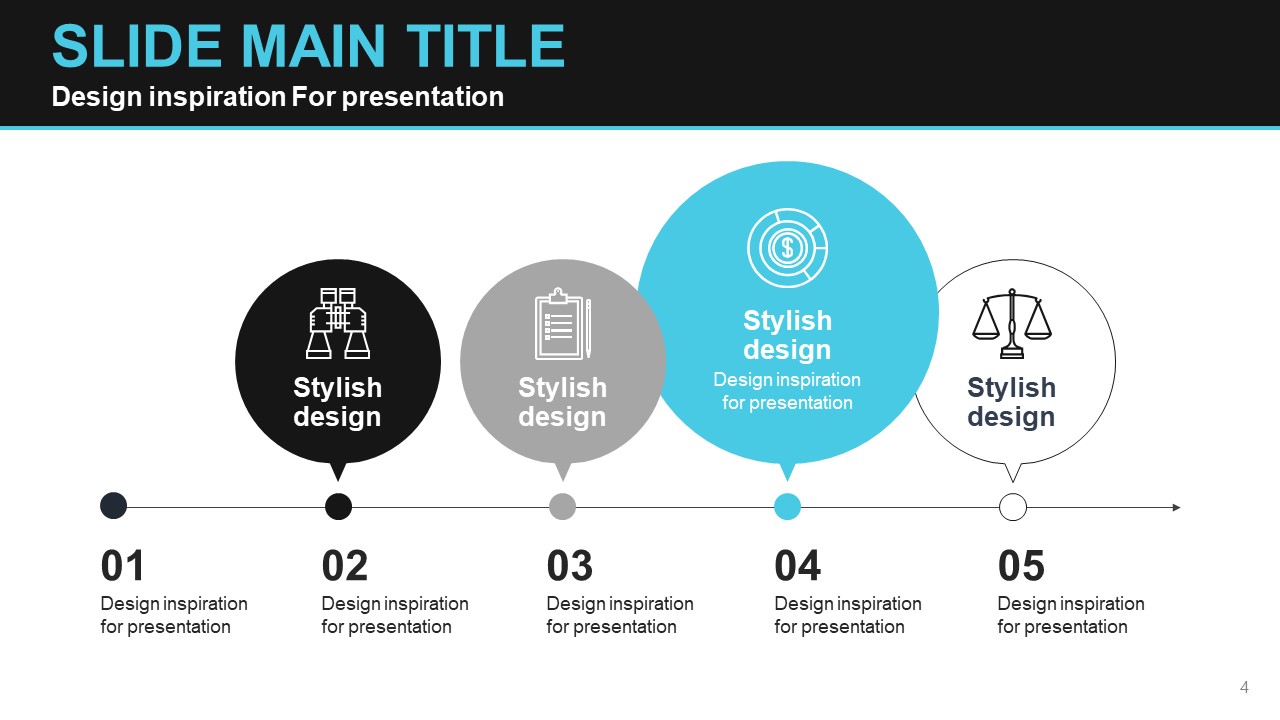
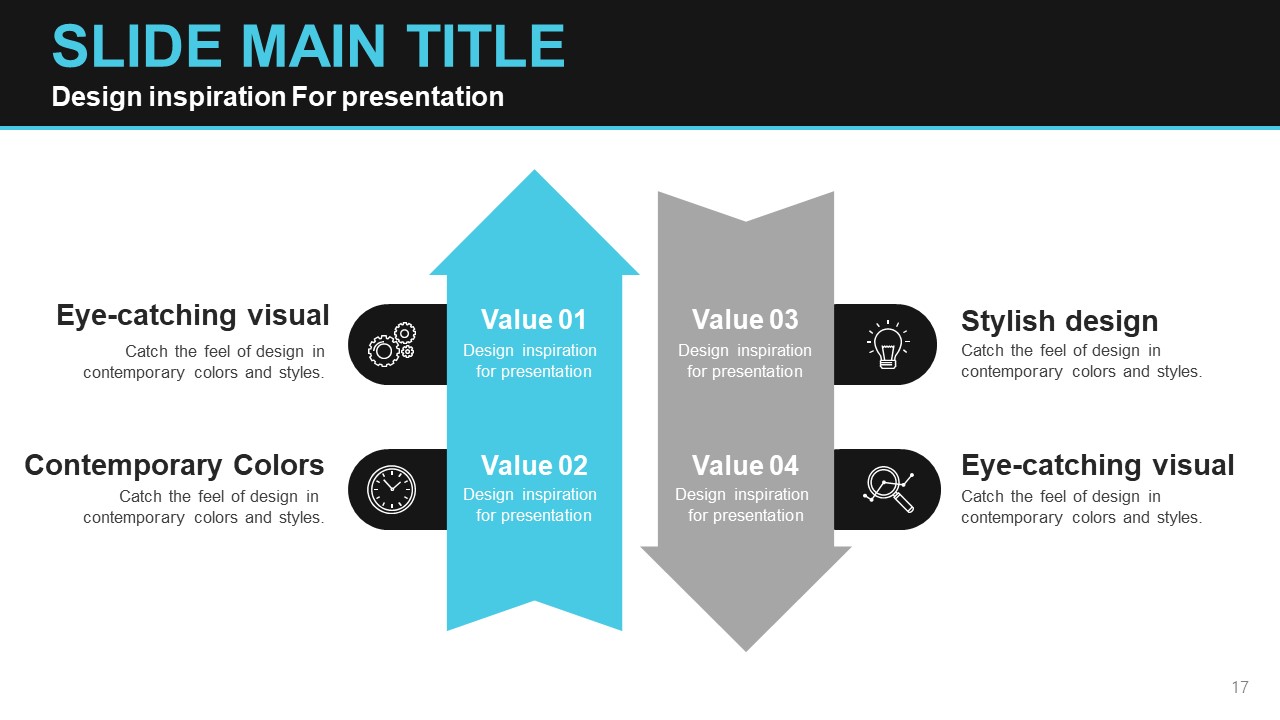
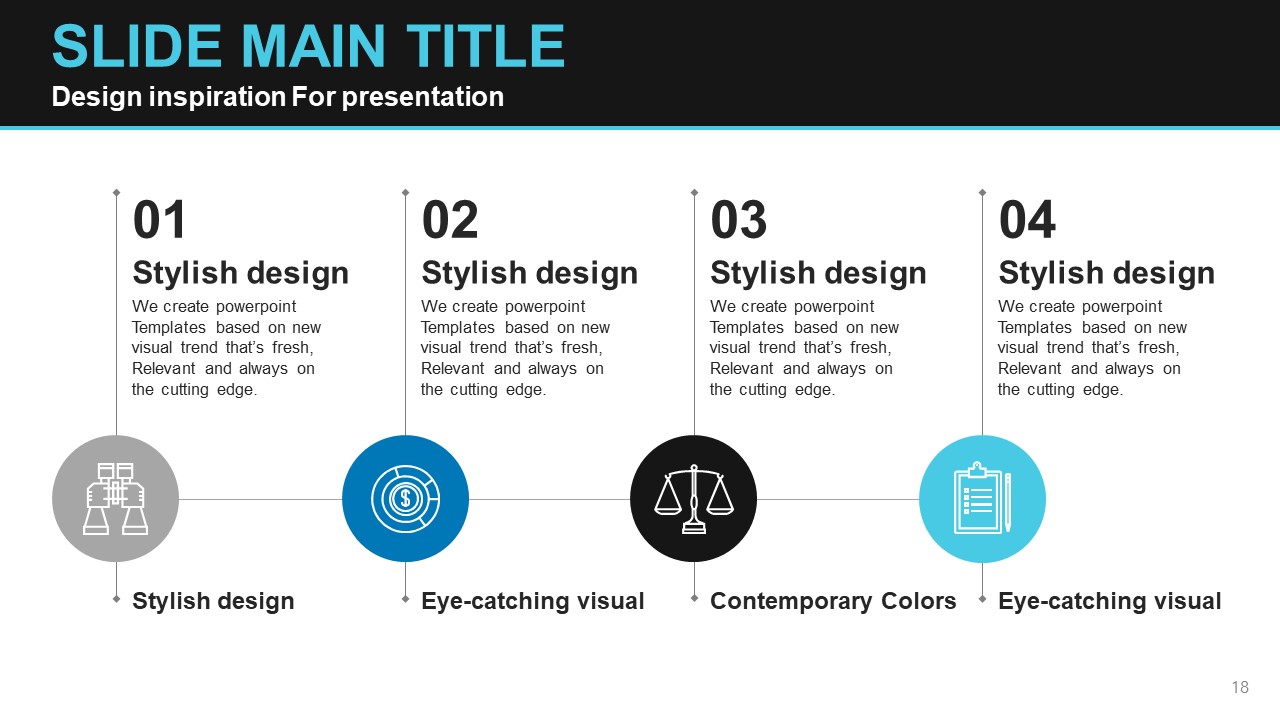
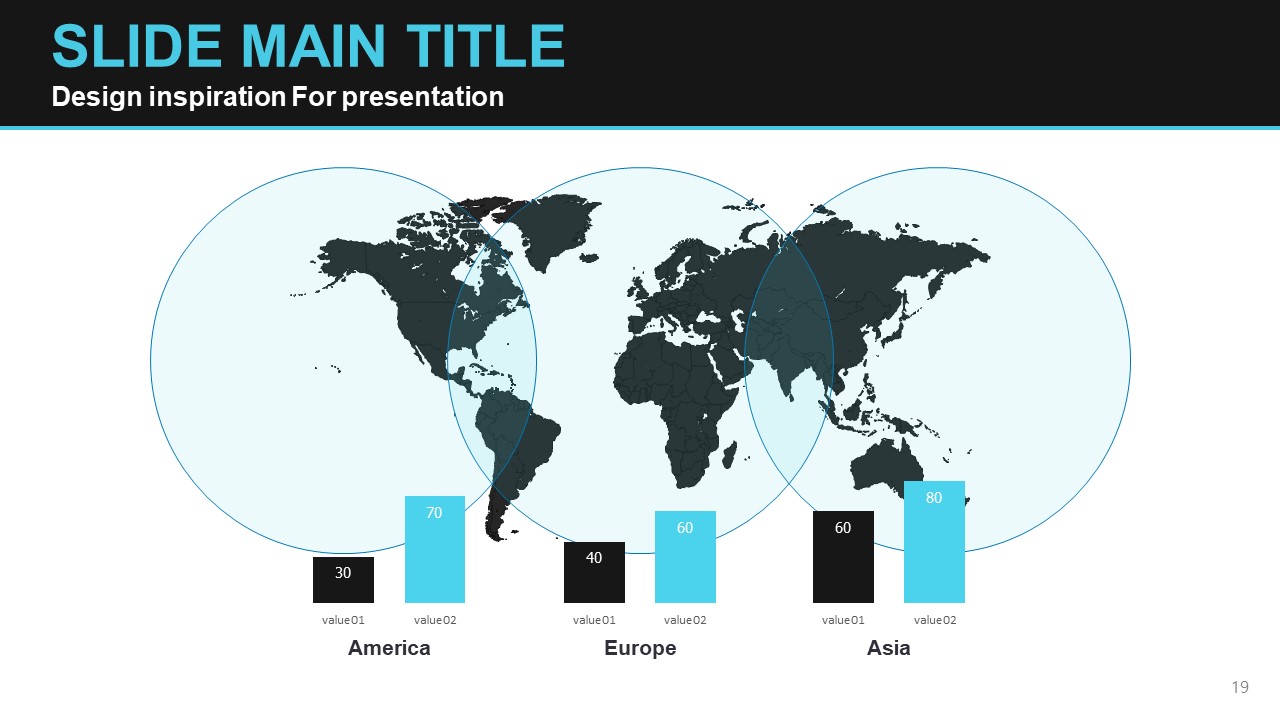
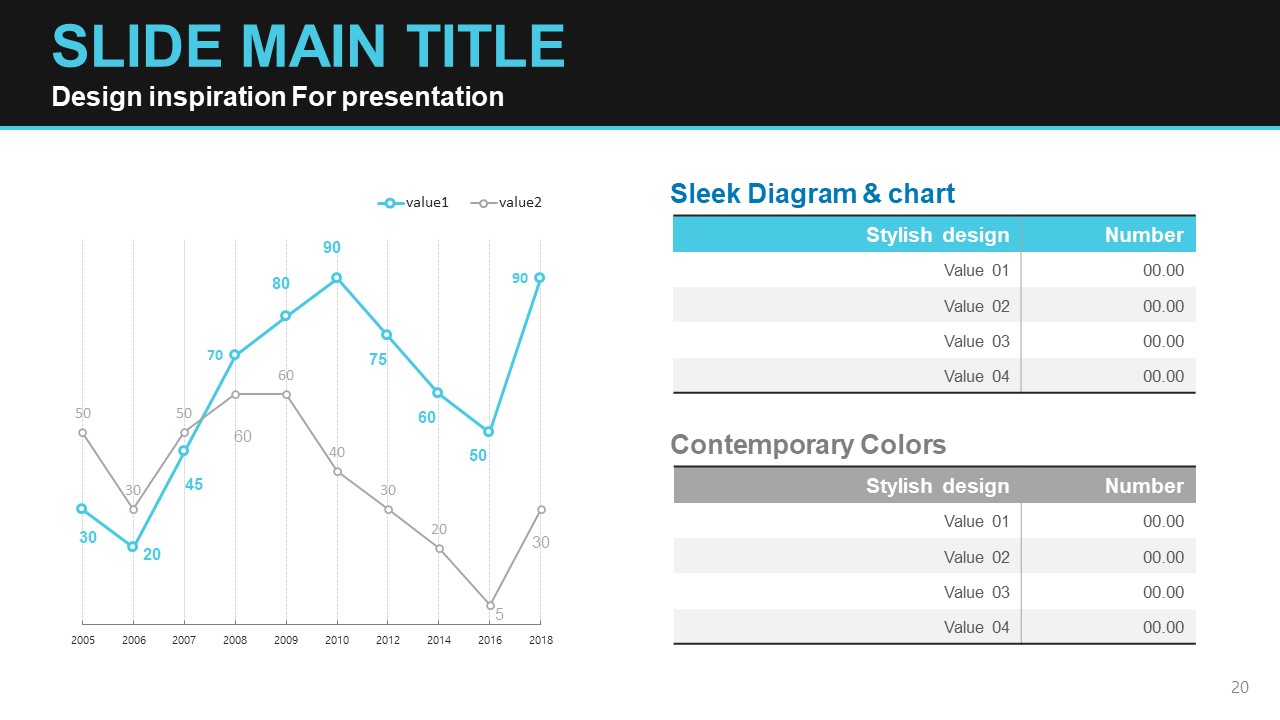
30 slides including a 3D light bulb cover slide, 5-step process diagram, pictogram infographic with percentage data, bar chart slide, world map data visualization, radial icon diagram with 6 items, donut chart with silhouette, and a 4-bulb comparison layout.
Related Products
-

Ideas Conference Presentation Template – Stylish Business Design
#Business
-

Office Supplies Presentation Template – Catch Attention with Wide Design
#Business
-

Idea Wide Presentation Template – Modern and Visual Design
#Business
-

Container PPT Wide Template – Efficient Business Presentation Design
#Business
