Idea Analysis Strategy Chart – The Foundation of Business Operations
RJ0300066_29
- Last Update 05/06/2025
- File Size 0.5MB
- # of Slides 2
- File Format PPTX
- Slide Ratio 16:9
- Color
Keywords
- #Content-Based Slides
- #Design-Based Slides
- #Operational Plan
- #Financial Plans and Performance
- #Diagram
- #Business Support Plan
- #Sales and Revenue
- #Table
- #Standard Table
- #16:9
- #strategy table PowerPoint
- #comparison table slide
- #4-item analysis diagram
- #business operations template
- #idea analysis presentation slide
About the Product
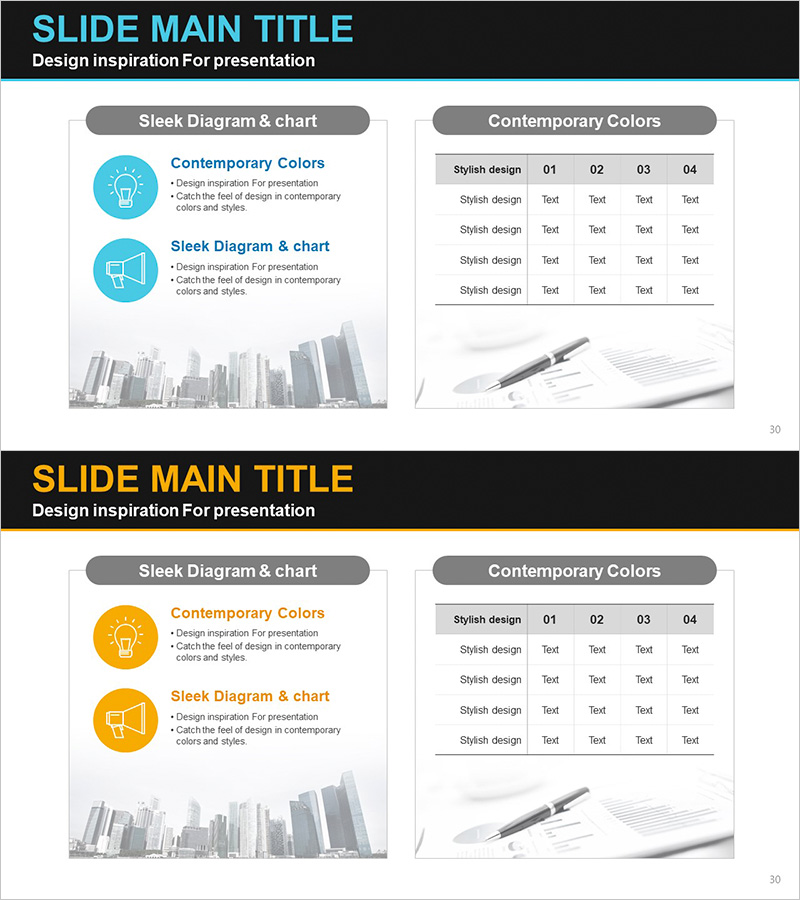
A 4-item comparison strategy table PowerPoint slide designed to visualize core business operations and strategic planning. The slide features a light gray background with cyan circular icons on the left side and a structured data table on the right, enabling clear presentation of idea analysis, strategy development, and operational planning stages. The 2-slide set includes the first slide with icon-based item descriptions and a 4×4 comparison table, while the second slide mirrors the same layout in an orange accent color scheme. Delivered in 16:9 widescreen PPTX format with fully editable elements, ideal for financial planning presentations, performance analysis reports, and operational strategy meetings.
Usage Points
-
Main Usage
Effectively categorizes and compares four key elements of business strategy, enabling clear differentiation of each component during idea generation and operational planning phases. Visually communicates strategic priorities and facilitates data-driven decision-making in executive presentations.
-
How to Use
Enter item titles and descriptions in the left icon section, then populate the right-side table with specific data, metrics, and characteristics. Select either the cyan or orange color scheme to match your corporate branding. All text areas are fully editable, and color/font customization is available through the slide master.
-
Recommended For
Internal strategy meetings, executive reports, business plan presentations, consulting proposals, and cross-functional team reviews. Particularly effective for scenarios requiring simultaneous comparison and evaluation of multiple proposals or operational initiatives.
-
Slide Structure
Slide 1: Left section contains 4 circular icons (lightbulb, speaker, etc.) with item titles and descriptions; right section displays a 4-row × 4-column comparison table (styles 01–04). Slide 2: Identical layout with orange accent color scheme. All text fields are editable in 16:9 widescreen PPTX format.
Related Products
-

Pie Chart and Table Metrics – Market Share Analysis
#Market and Competitor Analysis #Financial Plans and Performance #Diagram
-

Newspaper Wide PowerPoint Template Table for Financial Planning
#Financial Plans and Performance #Diagram #Sales and Revenue
-

Financial Planning and Scorecard Blue Orange
#Financial Plans and Performance #Diagram #Projected Return on Investment (ROI)
-

Colors Theme Presentation Template Table – Financial Planning and Performance
#Financial Plans and Performance #Diagram #Sales and Revenue
