Global Area Analysis Bar Graph – Visualization of Market and Competition
RJ0300066_18
- Last Update 05/06/2025
- File Size 0.6MB
- # of Slides 2
- File Format PPTX
- Slide Ratio 16:9
- Color
Keywords
- #Content-Based Slides
- #Design-Based Slides
- #Company Introduction
- #Market and Competitor Analysis
- #Graph
- #Other
- #Global Network
- #Market Analysis
- #Column
- #Grouped Column
- #Map
- #16:9
- #world map PowerPoint slide
- #regional analysis presentation
- #global market comparison chart
- #bar graph template
- #map-based data visualization
About the Product
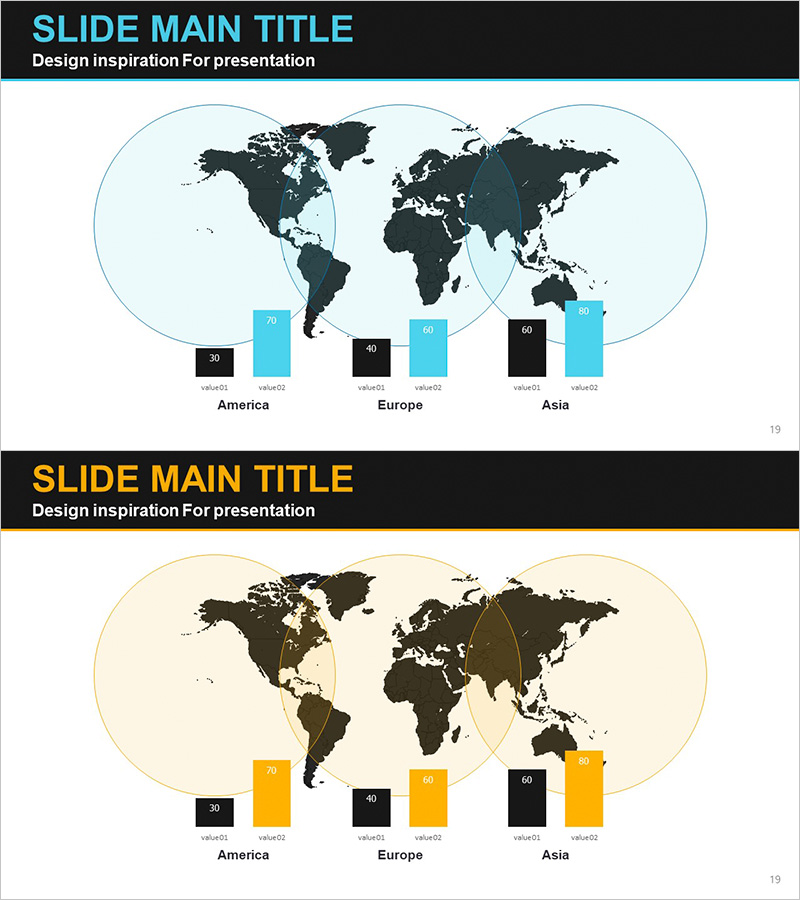
A global market analysis PowerPoint slide combining a world map with bar charts to compare data across three regions: America, Europe, and Asia. The dark-toned world map serves as the background, with light blue and black bar graphs positioned beneath each region to visualize comparative metrics. Each region displays two data series, enabling clear representation of market size, sales performance, or competitive positioning. The 2-slide deck in 16:9 widescreen format is ideal for investor presentations, quarterly business reports, and global strategy briefings where regional performance and competitive landscape need to be communicated effectively.
Usage Points
-
Main Usage
Designed to present regional market size, sales by geography, competitive market share, and other cross-regional comparison metrics at a glance. The overlay of bar charts on the world map simultaneously conveys geographic location and quantitative data.
-
How to Use
Input actual figures into the bar graphs beneath each region (America, Europe, Asia) to display regional comparative analysis. Use in investor presentations, quarterly business reports, and global strategy meetings to persuasively communicate international market status and regional performance.
-
Recommended For
Executives, marketing managers, sales leaders, management consultants, and investor relations professionals presenting global business performance. Particularly effective for multinational corporations reporting regional results, international market entry strategies, and competitive landscape analysis.
-
Slide Structure
Two-slide deck with each slide featuring a world map (dark-toned background) + three region labels + two bar graphs per region (light blue and black). First slide uses light blue circular background; second slide features beige circular background for design variation.
Related Products
-

Target Market Analysis Table
#Company Introduction #Market and Competitor Analysis #Diagram
-

Global Market Snapshot – Market Analysis and Outlook
#Company Introduction #Market and Competitor Analysis #Diagram
-

Leather Material Map Template - Global Network Visualization
#Company Introduction #Financial Plans and Performance #Graph
-

Green Energy Chart Map – Global Market Analysis
#Company Introduction #Market and Competitor Analysis #Graph
