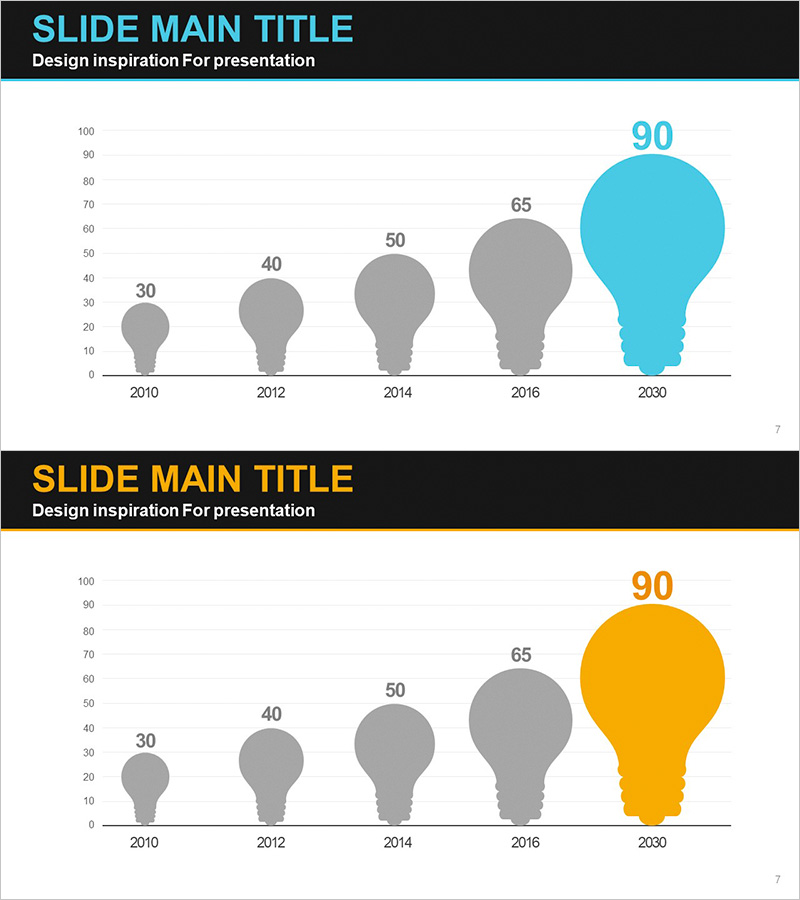
Light Bulb Graph for Market Trends – Future Oriented
RJ0300066_6
- Last Update 05/06/2025
- File Size 0.1MB
- # of Slides 2
- File Format PPTX
- Slide Ratio 16:9
- Color
Keywords
About the Product
A visually compelling light bulb-shaped graph PowerPoint slide that illustrates market trends and future forecasts through intuitive data representation. The 2-slide set uses contrasting gray and cyan tones to emphasize current state versus future growth potential. Five data points from 2010 to 2030 are visualized through progressive bulb size increases, making it ideal for competitive analysis, market projections, and growth scenario presentations. Delivered in 16:9 widescreen PPTX format with fully editable elements, this presentation template adapts seamlessly to business plans, investor pitches, and strategic forecasts.
Usage Points
-
Main Usage
Transforms market trends, competitive analysis, and future projections into an intuitive visual narrative using progressive bulb sizing. Compares five time-indexed data points (2010–2030) to simultaneously showcase historical performance and future targets, creating a compelling growth story.
-
How to Use
Two slides provided with distinct color schemes—cyan accent on slide 1, orange accent on slide 2—enabling flexible deployment across presentation contexts. Edit numerical values and years to reflect actual data, adjust colors to match corporate branding, and insert into business plans, marketing strategies, and investor relations materials to powerfully communicate growth trajectories.
-
Recommended For
Ideal for executives and planning teams presenting market growth rates during strategy sessions, marketing professionals proposing new business initiatives with forward-looking projections, and startup founders or corporate leaders pitching growth potential to investors and stakeholders.
-
Slide Structure
Two-slide layout with each slide containing five light bulb shapes arranged horizontally. Slide 1 features four gray bulbs plus one cyan bulb; Slide 2 features four gray bulbs plus one orange bulb. Each bulb is labeled with numerical values (30, 40, 50, 65, 90) and corresponding years (2010, 2012, 2014, 2016, 2030) positioned above.
Related Products
-

Bar Chart of Bike Exercise – Market Trends and Future Outlook
#Market and Competitor Analysis #Graph #Future Outlook
-

Future Outlook Line Graph Blue Orange
#Market and Competitor Analysis #Graph #Other
-

Camping Business Trend Graph – Future and Vision
#Market and Competitor Analysis #Graph #Customer Analysis
-

Online Presentation Template Line Chart – Market Trends and Visualization
#Market and Competitor Analysis #Graph #Future Outlook
