Market Analysis Segmented Bar Graph & Table Chart – Visualization of Competitive Analysis
RJ0300066_23
- Last Update 05/06/2025
- File Size 0.1MB
- # of Slides 2
- File Format PPTX
- Slide Ratio 16:9
- Color
Keywords
- #Content-Based Slides
- #Design-Based Slides
- #Market and Competitor Analysis
- #Diagram
- #Graph
- #Competitor Analysis
- #Market Analysis
- #Table
- #Column
- #Standard Table
- #Segmented Column
- #16:9
- #segmented bar graph PowerPoint
- #competitive analysis slide
- #market analysis chart
- #multi-series bar chart PowerPoint
- #data visualization template
About the Product
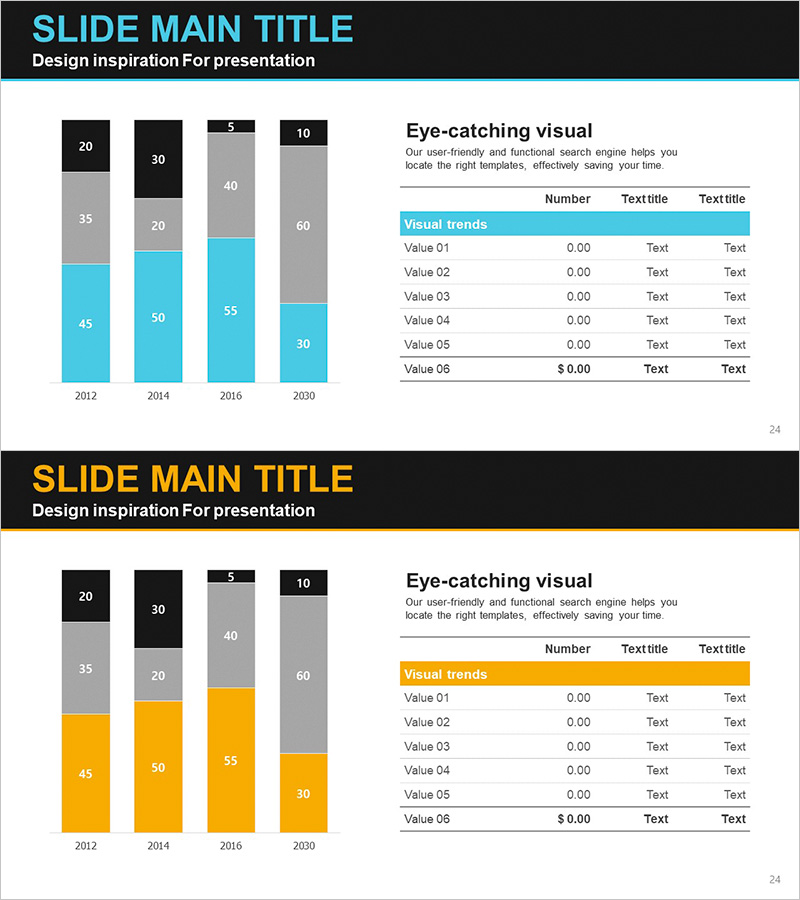
A professional PowerPoint slide template featuring a segmented bar graph and data table, designed for market analysis and competitive comparison presentations. The visualization displays four data series (black, gray, cyan, and orange) spanning from 2012 to 2030, with corresponding numerical values in the adjacent table. Formatted in 16:9 widescreen PPTX, the slide combines a dark header with a light content area to maximize visual contrast and audience engagement. The layout is ready for immediate use in business reports, strategy presentations, and investor pitches.
Usage Points
-
Main Usage
Presents multi-series data comparisons such as market size trends, competitor performance benchmarks, and industry growth patterns. The segmented structure enables clear visual differentiation between data series while the accompanying table provides precise numerical context.
-
How to Use
Input your year-over-year or category-based data into the segmented bar graph on the left, and populate the data table on the right with detailed figures. Customize the color series to match your corporate branding, and update the header text and legend labels to align with your presentation topic.
-
Recommended For
Marketing strategy presentations, business performance reports, investor pitch decks, competitive landscape analysis, quarterly business reviews, and market research findings where multi-dimensional data comparison is essential.
-
Slide Structure
Slide 1 features a black header with a 4-series segmented bar chart (2012–2030) and a 6-row, 3-column data table on the right. Slide 2 provides the same layout with an orange header variant. Both slides are independently usable and fully customizable.
Related Products
-

Subdivided Bar Graph for Visual Market Analysis – Presenting Competitive Data Effectively
#Market and Competitor Analysis #Diagram #Graph
-

Console Game Analysis Bar Graph – Market and Competitive Analysis
#Market and Competitor Analysis #Graph #Competitor Analysis
-

Sales and Profit Analysis Graph – Market Trends and Forecast
#Market and Competitor Analysis #Diagram #Graph
-

Market Trend Analysis Graph – Visualizing Market Status
#Market and Competitor Analysis #Diagram #Graph
