Gender Ratio Analysis Graph Chart – Data Visualization and Customer Insights
RJ0300066_12
- Last Update 05/06/2025
- File Size 0.3MB
- # of Slides 2
- File Format PPTX
- Slide Ratio 16:9
- Color
Keywords
- #Content-Based Slides
- #Design-Based Slides
- #Market and Competitor Analysis
- #Graph
- #Other
- #Customer Analysis
- #Competitor Analysis
- #Column
- #Other
- #Grouped Column
- #Other Charts
- #16:9
- #gender ratio graph
- #infographic chart PowerPoint
- #bar chart presentation
- #data visualization slide
- #customer analysis template
About the Product
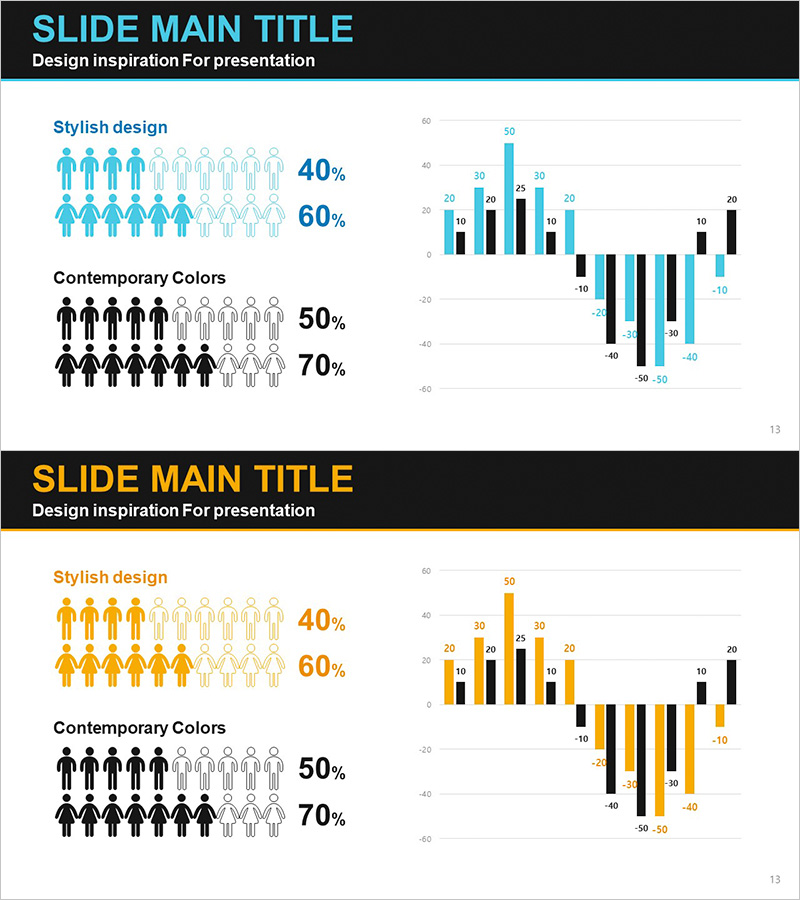
An infographic graph slide for gender ratio analysis combining human silhouette icons with bar charts in two design variations. The first slide visualizes 40% and 60% ratios using cyan-toned human icons, while the second applies an orange color scheme to the same data. The vertical bar graph on the right displays five data points ranging from +50 to -50, enabling simultaneous comparison of positive and negative values. Delivered in editable PPTX format, all elements can be customized for immediate use in customer analysis, market research, and gender-based statistical presentations.
Usage Points
-
Main Usage
Visualizes gender-based customer segmentation, market demographics, and statistical data at a glance. Human silhouette icons display gender composition while bar graphs show numerical trends, making it ideal for marketing reports and business analysis presentations.
-
How to Use
Use slide 1 for gender ratio overview and slide 2 for detailed numerical comparison. Customize icon colors (cyan/orange) for different datasets and edit graph values and labels to reflect actual survey data directly in PowerPoint.
-
Recommended For
Marketing teams analyzing target demographics, market researchers presenting population statistics, sales strategy presentations, and product development teams visualizing user segmentation. Particularly effective for presentations requiring gender-based purchase behavior, preference, and satisfaction data visualization.
-
Slide Structure
Slide 1: Left side shows two rows of 10 human icons each displaying 40% and 60% ratios; right side displays vertical bar graph with 5 data points. Slide 2: Identical layout with orange color scheme applied. Both slides feature black header area and white content area with all shapes, text, and values independently editable.
Related Products
-

Gender Analysis Graph – Stylish Slide for Customer Analysis
#Market and Competitor Analysis #Marketing Plan and Strategy #Graph
-

Segmented Square 3D Graph: Market & Competitive Analysis
#Market and Competitor Analysis #Graph #Other
-

Customer Analysis Gender Ratio Analysis Graph - Key to Market Understanding
#Market and Competitor Analysis #Graph #Other
-

Human Details Infographic Chart – Customer Analysis and Market Overview
#Market and Competitor Analysis #Graph #Other
