Diagram Slide Template Visualizing Financial Business Process Steps
RJ0300066_17
- Last Update 05/06/2025
- File Size 0.1MB
- # of Slides 2
- File Format PPTX
- Slide Ratio 16:9
- Color
Keywords
- #Content-Based Slides
- #Design-Based Slides
- #Business Strategy
- #Business Management
- #Diagram
- #Step-by-Step Schedule Plan
- #Implementation Plan
- #Cluster
- #Chain Diagram
- #16:9
- #connected diagram PowerPoint
- #4-step process slide
- #financial business presentation
- #process flow diagram
- #sequential visualization slide
About the Product
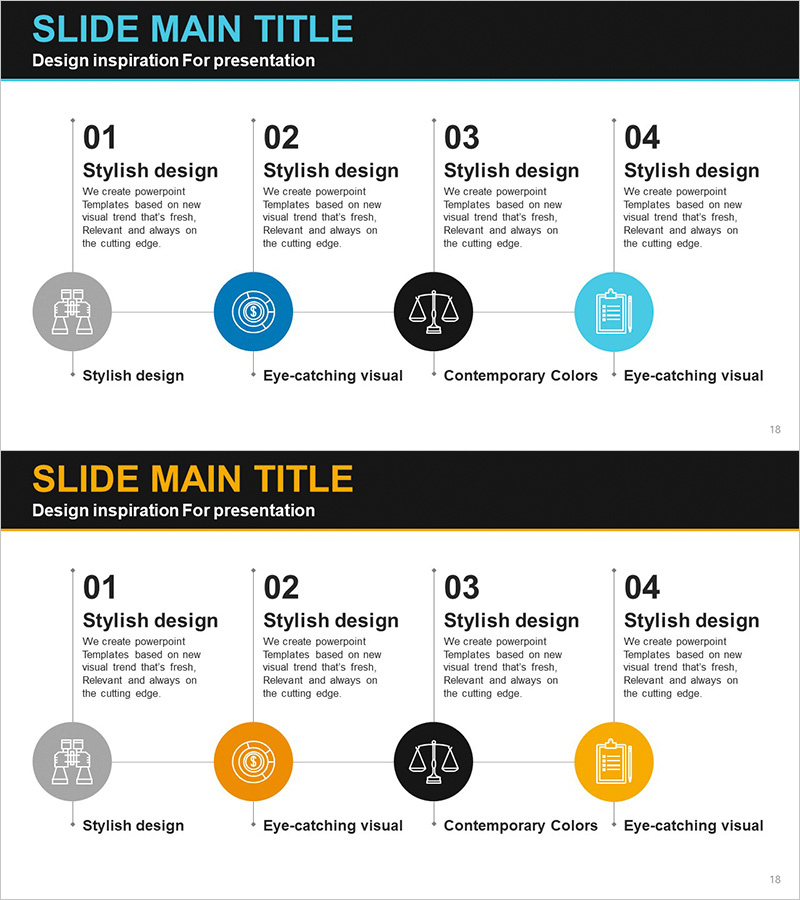
A 4-step connected diagram PowerPoint slide that visualizes financial and business process flows with sequential progression. Circular nodes linked by arrows create a clear linear flow structure, with color-coded icons (gray, blue, black, light blue) representing each stage's characteristics. Each node includes text areas for detailed stage descriptions, making it ideal for business presentations, financial product development processes, and project management timelines. This presentation template is ready to use immediately across various professional contexts.
Usage Points
-
Main Usage
Effectively communicate sequential business and financial processes by visually representing each stage and its connection to the next. Ideal for project management, business strategy presentations, financial product development, and any scenario requiring clear linear process visualization.
-
How to Use
Edit the icons and text in each circular node to match your specific process stages. Customize colors to distinguish between different priority levels or categories. The connecting arrows emphasize process sequence and dependencies, making them effective for highlighting workflow progression.
-
Recommended For
Finance professionals, project managers, business consultants, corporate strategy officers, and educators presenting process explanations, business plans, project status reports, and workflow documentation.
-
Slide Structure
Two-slide layout featuring a linear flow of four circular nodes connected by left-to-right arrows. Each slide includes a title area at the top and descriptive text fields below each node. Color-differentiated icons (person, gear, scale, clipboard) visually represent each stage's function and meaning.
Related Products
-

Schedule Planning Speech Bubble Diagram – Business Strategy and Connection Design
#Business Strategy #Business Management #Diagram
-

Mountain Climbing Aftercare and Maintenance Plan
#Business Strategy #Business Management #Diagram
-

Business Future Execution Plan STEP5 – Cluster Diagram
#Business Strategy #Business Management #Diagram
-

Step-by-Step Mountain Climbing Business Plan Slide
#Business Strategy #Business Management #Diagram
