Development Status Pie Chart – Efficient Data Delivery
RJ0300066_5
- Last Update 05/06/2025
- File Size 0.1MB
- # of Slides 2
- File Format PPTX
- Slide Ratio 16:9
- Color
Keywords
- #Content-Based Slides
- #Design-Based Slides
- #Product/Service Introduction
- #Market and Competitor Analysis
- #Graph
- #Development Status
- #Market Share
- #Circles
- #Pie Chart
- #16:9
- #pie chart PowerPoint slide
- #pie graph template
- #3-section pie chart
- #development status visualization
- #data presentation slides
- #percentage chart download
About the Product
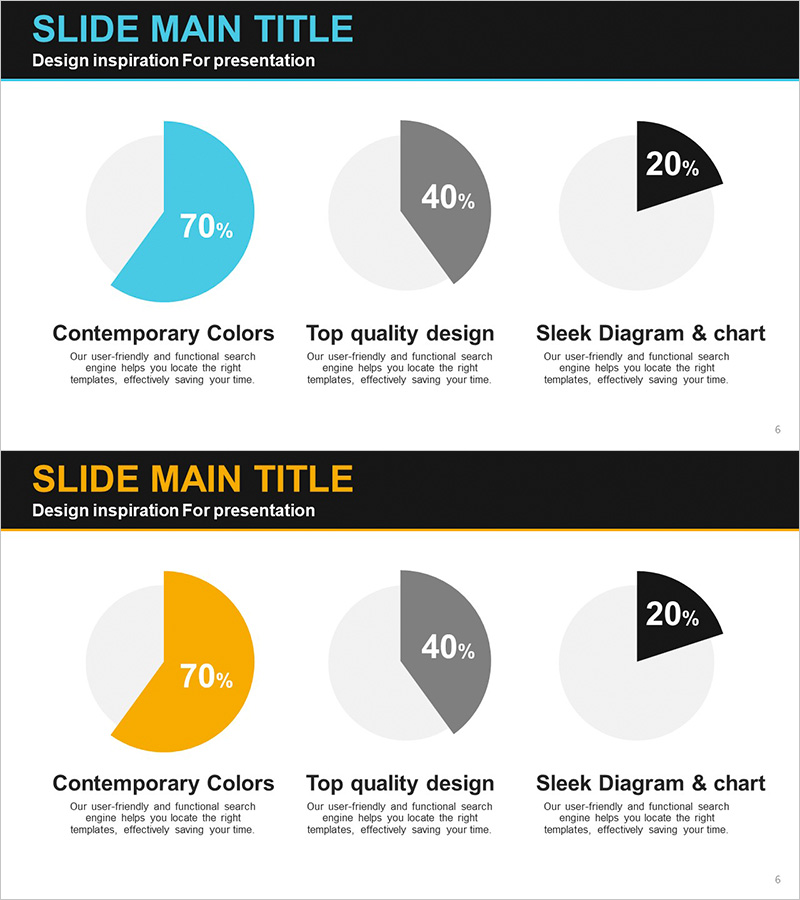
A pie chart PowerPoint slide template designed to display development progress, market share, and project completion rates across three distinct segments. The slide deck features three color variations—cyan, gray, and black—with clear percentage labels for each section, enabling intuitive data representation in presentations. This 2-slide set includes color variations in cyan and golden yellow tones, allowing you to select the design that best matches your presentation theme and audience context. Ideal for business reports, investor pitches, and strategic planning meetings where proportional data visualization is essential.
Usage Points
-
Main Usage
Effectively communicate proportional data such as development progress, market share distribution, project completion status, and customer satisfaction levels. The three-segment pie chart design enables viewers to instantly grasp the composition ratio of each category, while percentage labels ensure accurate numerical data delivery without ambiguity.
-
How to Use
Perfect for executive briefings, investor presentations, project status updates, and marketing strategy meetings. The 2-slide format provides flexibility—choose between the cyan-toned or golden yellow-toned design based on your presentation background and corporate branding. Easily customize percentages and labels to match your specific data.
-
Recommended For
Executive management reports, marketing team market analysis presentations, development team project status reports, sales team customer satisfaction analysis, finance team budget allocation explanations, and any quantitative data-driven business presentation requiring clear visual hierarchy.
-
Slide Structure
Slide 1: Cyan-background 3-section pie chart with sample data (70%, 40%, 20%) and labeled segments / Slide 2: Golden yellow-background pie chart with identical structure. Each slide includes a title area, three pie chart sections with percentage labels, and legend text zones. All colors, percentages, and text are fully editable.
Related Products
-

Internet Shopping Market Analysis Chart
#Product/Service Introduction #Market and Competitor Analysis #Diagram
-

Securities Business Analysis Circle Graph
#Product/Service Introduction #Market and Competitor Analysis #Graph
-

Development Status Pie Chart – Visualizing Product Progress
#Product/Service Introduction #Market and Competitor Analysis #Graph
-

Pie Chart about War – Visualizing Information
#Product/Service Introduction #Market and Competitor Analysis #Graph
