Target Country Analysis Bar Graph Map – Providing Market Insights
RJ0300066_26
- Last Update 05/06/2025
- File Size 0.6MB
- # of Slides 2
- File Format PPTX
- Slide Ratio 16:9
- Color
Keywords
- #Content-Based Slides
- #Design-Based Slides
- #Market and Competitor Analysis
- #Graph
- #Other
- #Market Analysis
- #Target Market
- #Horizontal Bar
- #Grouped Horizontal Bar
- #Map
- #16:9
- #world map PowerPoint slide
- #horizontal bar chart template
- #country analysis slide
- #regional comparison chart
- #global market analysis diagram
About the Product
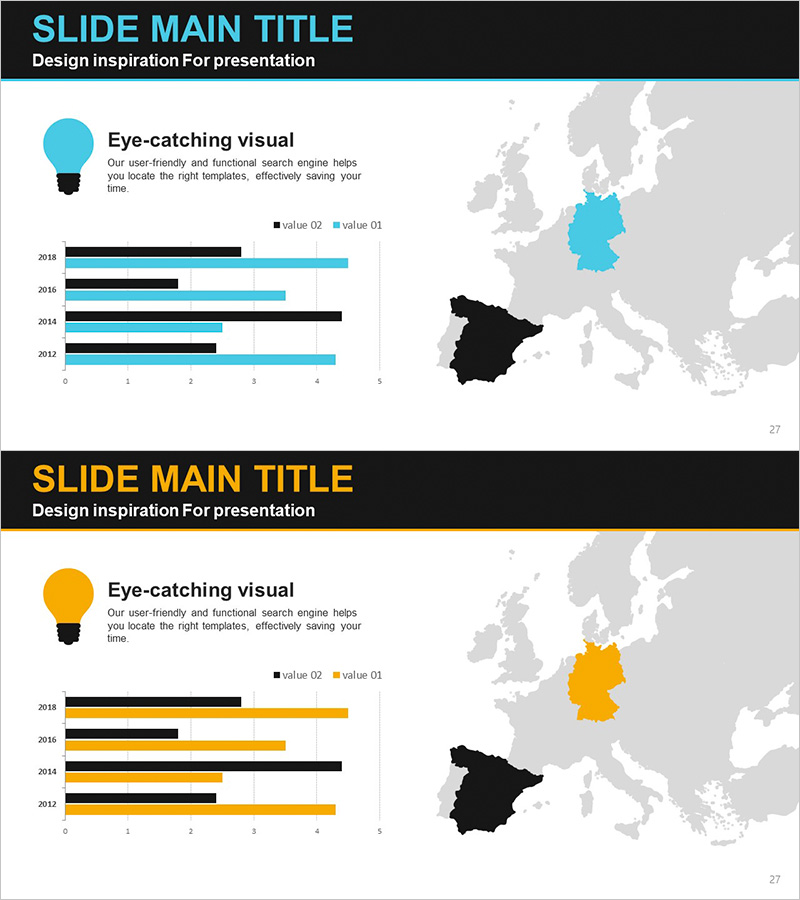
A world map-based horizontal bar chart PowerPoint slide for visualizing country-specific market data. This 2-slide template uses two color schemes (cyan and gold) to clearly distinguish between target countries and comparison regions. The left-side horizontal bar chart displays four years of data (2018–2012) across two value series, while the right-side world map highlights Germany and Spain to provide geographic context for market performance. Ideal for international presentations, market analysis reports, regional performance comparisons, and global strategy documents. Ready to customize with your own data and instantly applicable to business decks and strategic planning materials.
Usage Points
-
Main Usage
Visualize international market analysis and regional performance comparisons. This slide merges geographic context (world map with highlighted countries) with quantitative data (horizontal bar chart) to clearly communicate regional differences. Perfect for global business strategy, export-import trends, international partnership plans, and any presentation requiring country-by-country analysis.
-
How to Use
Input your year-by-year and category-specific data into the left horizontal bar chart. Select and highlight your target countries on the right world map, adjusting colors as needed. Update the legend labels (value 01, value 02) to match your data categories and edit the title and descriptive text to fit your presentation context. The two-color layout is optimized for competitive comparisons, year-over-year growth rates, and primary market vs. emerging market contrasts.
-
Recommended For
Executives, marketing teams, sales departments, strategic planning units, and international business teams presenting global market status. Suitable for investor pitch decks, quarterly business reports, market entry strategy presentations, international partnership proposals, and regional sales performance analyses where geographic and comparative emphasis is critical.
-
Slide Structure
2-slide set. Each slide features a horizontal bar chart on the left (4 years: 2018, 2016, 2014, 2012 with 2 data series) and a world map on the right (Europe-focused with Germany and Spain highlighted). Includes title area, legend display, and 0–5 scale X-axis. Two distinct color series (cyan and gold) differentiate data categories. 16:9 widescreen format optimized for modern presentation environments.
Related Products
-

European Target Market Analysis Bar Graph – Market Vision and Opportunities
#Market and Competitor Analysis #Graph #Other
-

Target Country Analysis Chart – Data Visualization for Market Analysis
#Market and Competitor Analysis #Graph #Other
-

Market Status and Trends Horizontal Bar Chart Slide
#Market and Competitor Analysis #Graph #Other
-

Science and Technology Observation Target Market – Market Analysis Slide
#Market and Competitor Analysis #Other #Market Analysis
