Silhouette Diagram & Circle Donut Graph – Visual Tool for Customer Analysis
RJ0300066_22
- Last Update 05/06/2025
- File Size 0.1MB
- # of Slides 2
- File Format PPTX
- Slide Ratio 16:9
- Color
Keywords
- #Content-Based Slides
- #Design-Based Slides
- #Product/Service Introduction
- #Market and Competitor Analysis
- #Graph
- #Other
- #Composition
- #Customer Analysis
- #Circles
- #Doughnut Chart
- #Silhouette
- #16:9
- #silhouette diagram PowerPoint
- #donut chart slide
- #customer analysis presentation
- #market segmentation slide
- #5-segment donut graph
- #silhouette PPT template
About the Product
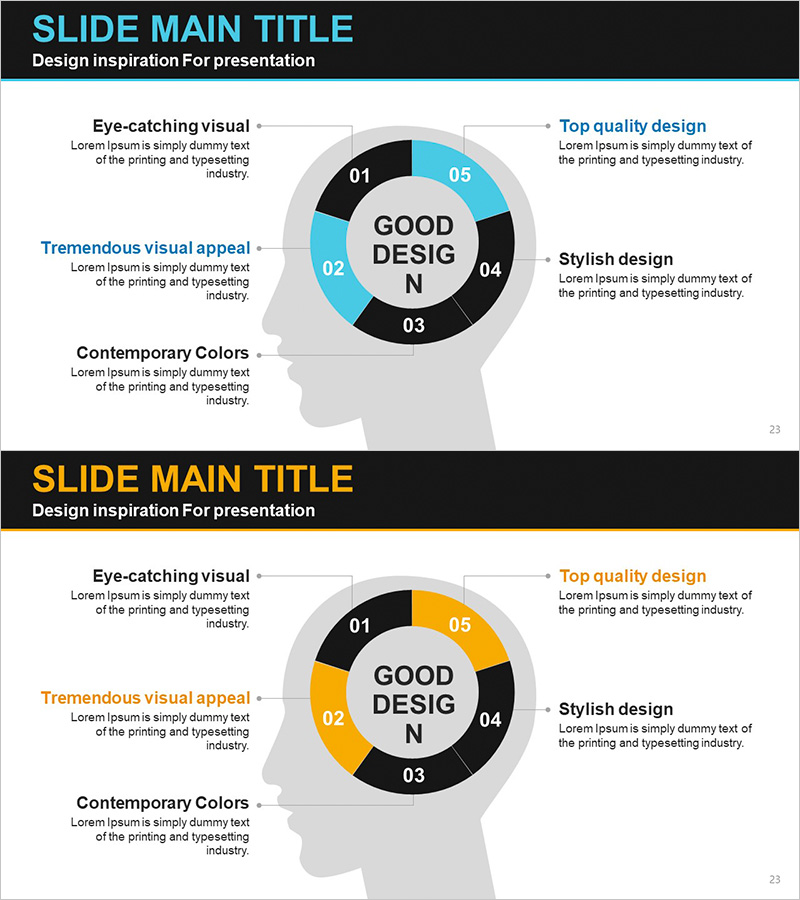
A PowerPoint slide combining silhouette diagram and 5-segment donut chart for customer analysis and market research. The donut graph is positioned at the center of a human silhouette, enabling visual representation of customer characteristics, market segmentation, and product preferences. The two-tone color scheme of black and cyan clearly distinguishes data emphasis areas, while descriptive text fields on both sides facilitate natural presentation flow. Two-slide set includes color variations (cyan-black and orange-black) for flexible tone matching across presentation sections.
Usage Points
-
Main Usage
Visualizes qualitative data such as customer analysis, market segmentation, product preferences, and target audience characteristics. The combination of human silhouette and donut graph emphasizes human-centered data interpretation, effectively communicating customer insights during marketing, sales, and strategic planning phases.
-
How to Use
Input numerical values for five items into the central donut chart and add descriptive text in left and right text areas (customer traits, purchase motivations, preferred channels, etc.). Use color variation slides to differentiate presentation sections visually and strengthen tonal consistency.
-
Recommended For
Marketing professionals, sales strategists, market research analysts, product planners, and executives preparing customer segmentation reports, market positioning analyses, and target audience presentations.
-
Slide Structure
Slide 1: Cyan accent version – human silhouette with 5-segment donut chart at center, three descriptive items on left, two on right. Slide 2: Orange accent version – identical layout with color variation. Page number displayed at bottom right of each slide.
Related Products
-

Soccer Game Illustration Graph for Market and Competitive Analysis
#Business Strategy #Market and Competitor Analysis #Graph
-

Infographic in a Woman's Head – Data Analytics and Customer Insight
#Product/Service Introduction #Market and Competitor Analysis #Diagram
-

Businessperson Work Ability Analysis Graph – Successful Ability Assessment
#Product/Service Introduction #Market and Competitor Analysis #Diagram
-

Work Performance Analysis Graph – Visually Representing Employee Performance
#Market and Competitor Analysis #Graph #Other
