Country Analysis Map Graph for Market Insights
RJ0300066_9
- Last Update 05/06/2025
- File Size 0.2MB
- # of Slides 2
- File Format PPTX
- Slide Ratio 16:9
- Color
Keywords
- #Content-Based Slides
- #Design-Based Slides
- #Market and Competitor Analysis
- #Marketing Plan and Strategy
- #Graph
- #Other
- #Market Analysis
- #Target Market Strategy
- #Other
- #Other Charts
- #Map
- #16:9
- #world map PowerPoint slide
- #country analysis template
- #market comparison chart
- #global market analysis slide
- #geographic data visualization PowerPoint
About the Product
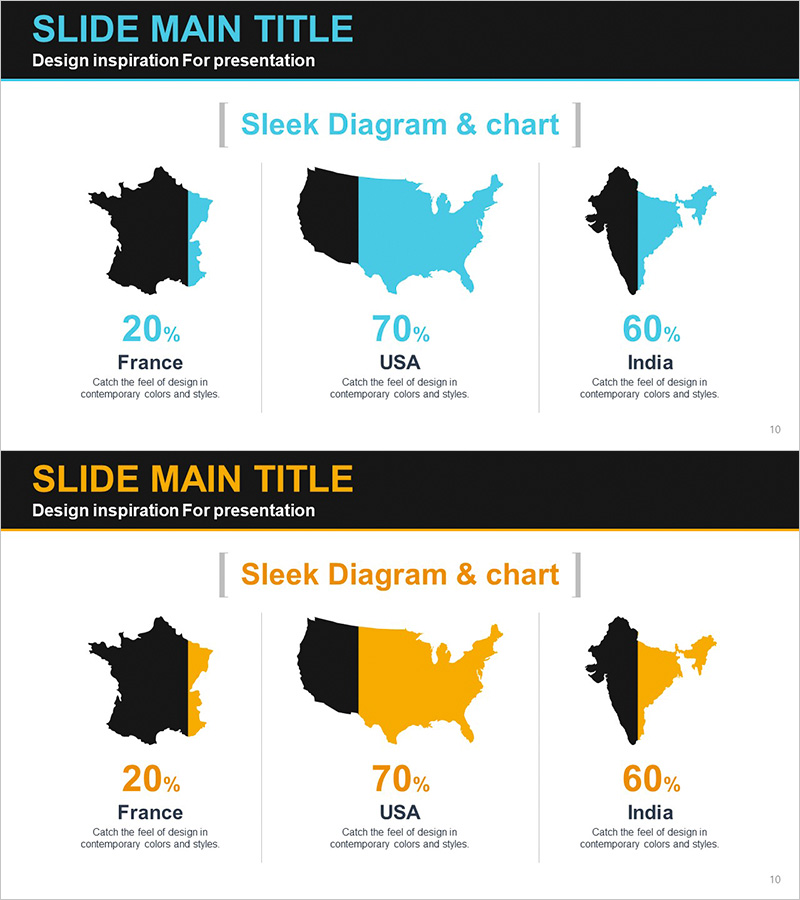
A geography-based PowerPoint slide template for comparing market size across countries. This presentation slide features maps of France, USA, and India with black and cyan color differentiation to display market share percentages (20%, 70%, 60%) at a glance. Designed in 16:9 widescreen format with 2 slides, it is ready for immediate use in marketing strategy presentations, market analysis reports, and global business pitches. The slide deck combines geographic data with numerical metrics, making it ideal for business presentations, investor decks, and strategic planning documents.
Usage Points
-
Main Usage
Visualize global market distribution and country-level business performance using geographic mapping. This slide template effectively communicates regional market share, revenue distribution, and customer concentration across territories. It supports executive reporting, investor presentations, and strategic market planning with credible geographic context.
-
How to Use
Replace the sample maps and percentage data with your actual market information. Use the color differentiation (black/cyan) to highlight comparison targets, and input your own percentages to customize for your presentation context. Additional countries can be added by duplicating the slide layout while maintaining consistent design structure.
-
Recommended For
Marketing managers, executives, business analysts, and sales leaders presenting global market performance. Particularly effective for multinational corporations reporting regional results, launching market entry strategies, and pitching international business partnerships where geographic context strengthens the narrative.
-
Slide Structure
2-slide template featuring 3 country maps per slide with black base color and cyan accent highlighting. Layout includes title section at top, 3-column map arrangement in center, and percentage metrics with descriptive text below. Information hierarchy clearly separates geographic, numeric, and textual elements.
Related Products
-

Target Regional Analysis Slide – Market Analysis and Strategy
#Market and Competitor Analysis #Marketing Plan and Strategy #Other
-

Dot Map Graph for Market Analysis Visualization – Strategic Approach
#Market and Competitor Analysis #Marketing Plan and Strategy #Graph
-

Market Analysis with Hologram Map and Chart – Contemporary Visual Design
#Market and Competitor Analysis #Marketing Plan and Strategy #Other
-

US Target Market Map for Marketing Analysis
#Market and Competitor Analysis #Marketing Plan and Strategy #Graph
