Competitor Market Analysis Graph – Financial Performance and Competitive Advantage
RJ0300066_19
- Last Update 05/06/2025
- File Size 0.8MB
- # of Slides 2
- File Format PPTX
- Slide Ratio 16:9
- Color
Keywords
- #Content-Based Slides
- #Design-Based Slides
- #Market and Competitor Analysis
- #Financial Plans and Performance
- #Diagram
- #Graph
- #Competitive Advantage
- #Sales and Revenue
- #Table
- #Line
- #Standard Table
- #Line Chart
- #16:9
- #line chart PowerPoint slide
- #dual-series trend analysis
- #financial performance chart
- #competitive analysis graph
- #how to create line chart in PowerPoint
- #multi-series chart slide template download
About the Product
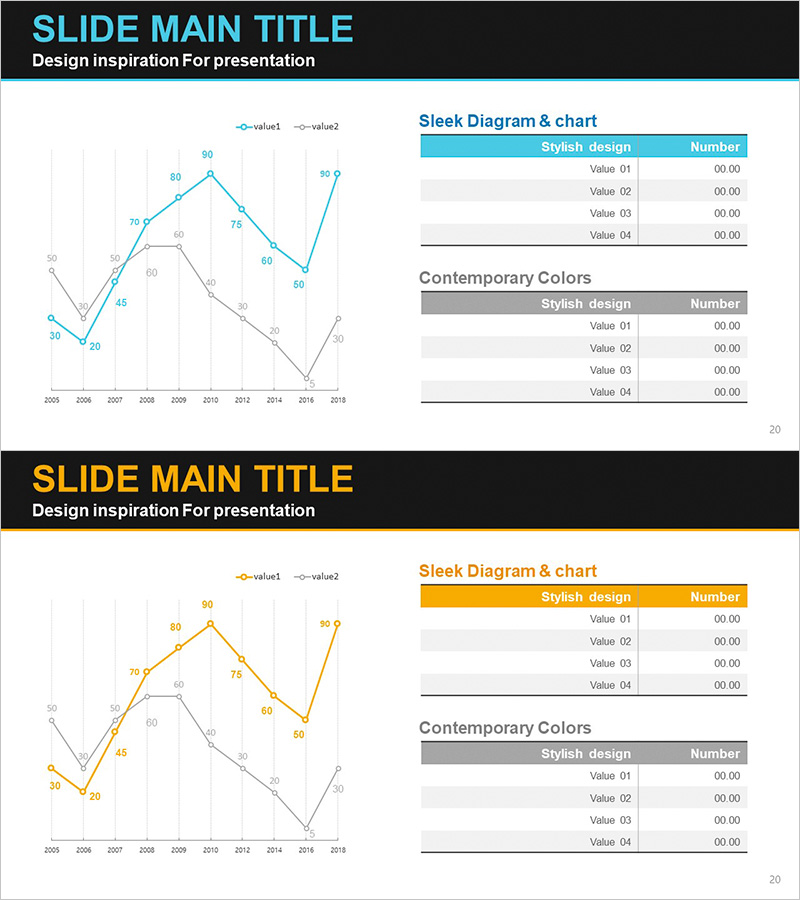
A professional two-series line chart PowerPoint slide designed for competitive market analysis and financial performance visualization. The slide displays data trends from 2005 to 2018 using distinct cyan and gray lines, with precise numerical labels at each data point for accurate information delivery. The right side features a legend table and color reference guide to enhance presentation credibility. Available in 16:9 widescreen format across 2 slides, this template is ready for immediate use in executive reports, business performance analysis, market research presentations, and competitive benchmarking decks.
Usage Points
-
Main Usage
Enables simultaneous comparison of two data series over time, ideal for visualizing competitive performance against company metrics or tracking multiple financial indicators. Designed for executive briefings, investor presentations, quarterly business reviews, and strategic performance analysis where trend comparison is critical.
-
How to Use
Input actual data into the left-side line chart and the trend lines update automatically. Customize the right-side legend and color reference tables to match your presentation context. Adjust data point labels to selectively highlight key metrics and emphasize specific performance indicators.
-
Recommended For
Finance teams, executives, marketing managers, management consultants, business analysts, and data professionals presenting quarterly or annual performance reports, competitive analysis, market research findings, and strategic business metrics to boards and stakeholder groups.
-
Slide Structure
Two-slide set with cyan-accent theme on slide 1 and gold-accent theme on slide 2. Each slide features a dual-series line chart (2005-2018 timeline, approximately 15 data points) on the left, paired with two reference tables on the right: a legend/description table and a color information table in a balanced two-column layout.
Related Products
-

Accumulated Line Chart – Market and Competitor Analysis
#Market and Competitor Analysis #Financial Plans and Performance #Graph
-

Graph Analysis by Year Sales
#Market and Competitor Analysis #Financial Plans and Performance #Graph
-

Sales and Net Income Graph – Visualizing Business Performance
#Market and Competitor Analysis #Financial Plans and Performance #Graph
-

Chair Sales Graph – Visual Data Analysis
#Market and Competitor Analysis #Financial Plans and Performance #Graph
