
Victory PowerPoint Wide Template – Stylish Design for Business
J0300029
- Last Update 01/06/2025
- File Size 13.3MB
- # of Slides 35
- File Format PPTX
- Slide Ratio 16:9
- Color
Slide Preview


Keywords
About the Product
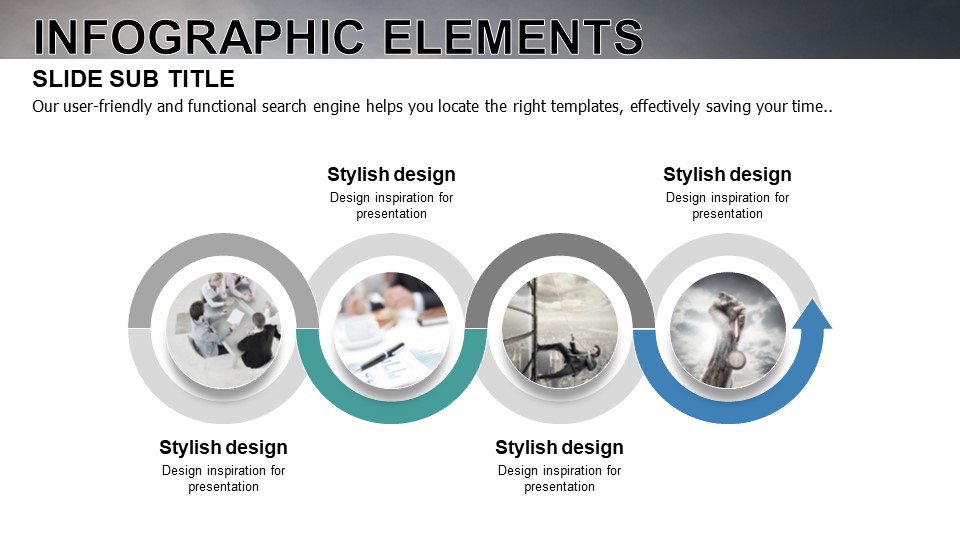
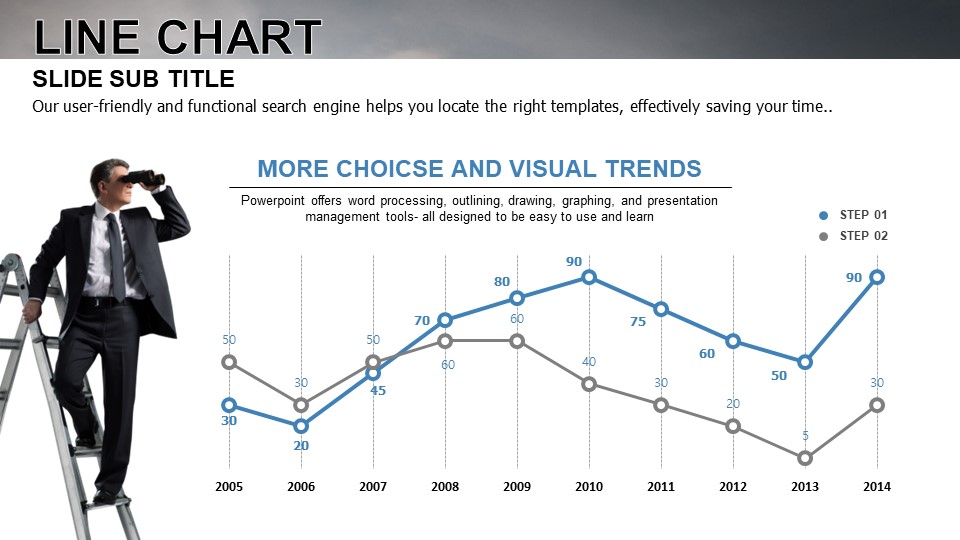
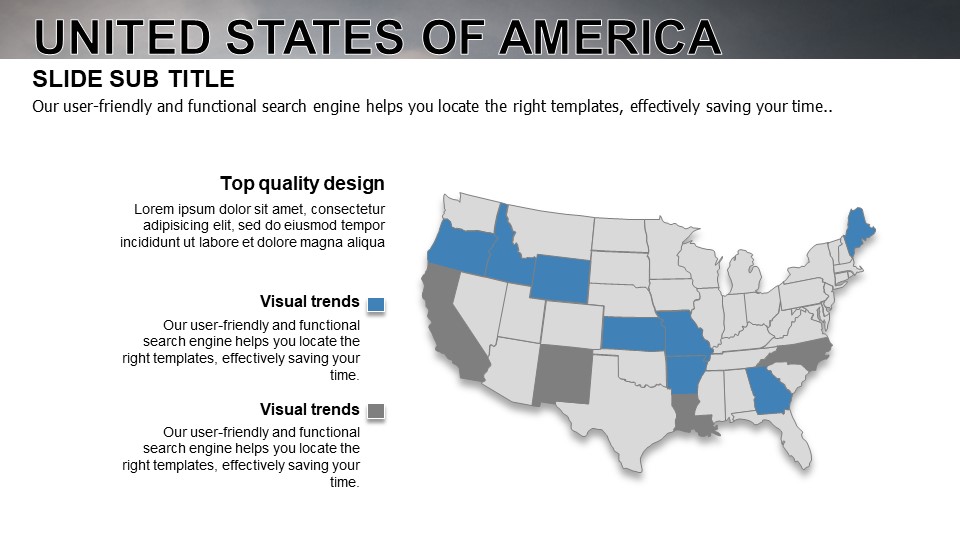
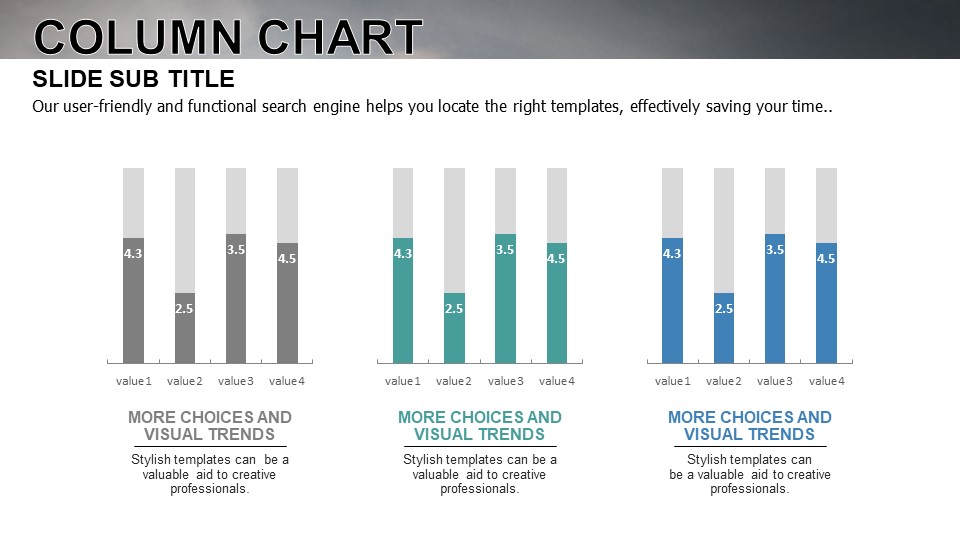
Make a powerful first impression with this business PowerPoint template featuring a bold victory medal image on the cover. Built on a gray-and-white background with blue and teal accent colors, this presentation template delivers a professional, high-impact look ideal for achievement-themed business slides. The 35-slide deck includes a wide variety of layouts: three-column card grids, circular infographic diagrams, a highlighted global map, smartphone screen mockups, and data comparison tables. Each slide is fully editable in PPTX format—simply replace text, images, and figures to match your content. Whether you're pitching to investors, reporting annual performance, or presenting a strategic roadmap, this PowerPoint template gives your message the visual authority it deserves.
Usage Points
-
Main Usage
Designed for high-stakes business presentations centered on achievement, goals, and results. Ideal for investor pitch decks, annual performance reports, and strategic planning sessions where a strong visual impact is essential.
-
How to Use
Open the PPTX file and replace text, images, and data in each slide to match your content. Choose from three-column cards, infographic diagrams, global maps, and table layouts to build a compelling presentation flow.
-
Recommended For
Best suited for executives and strategy teams delivering performance reviews, startup founders preparing investor IR decks, and sales or marketing managers presenting annual goal achievements to leadership.
-
Slide Structure
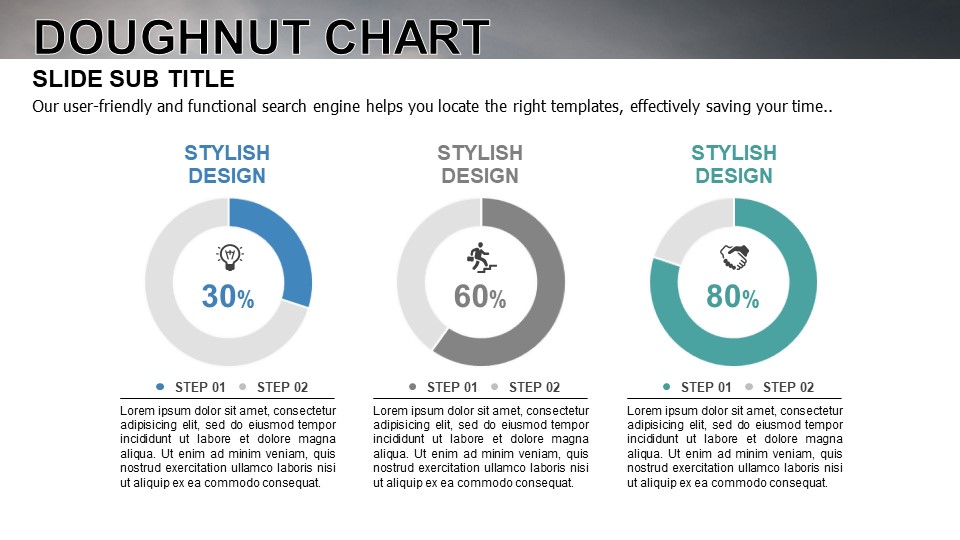
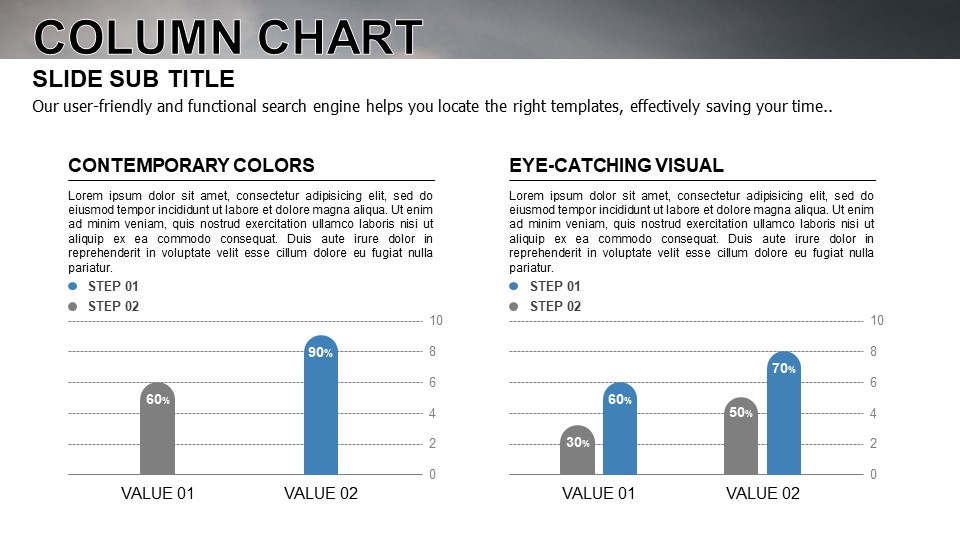
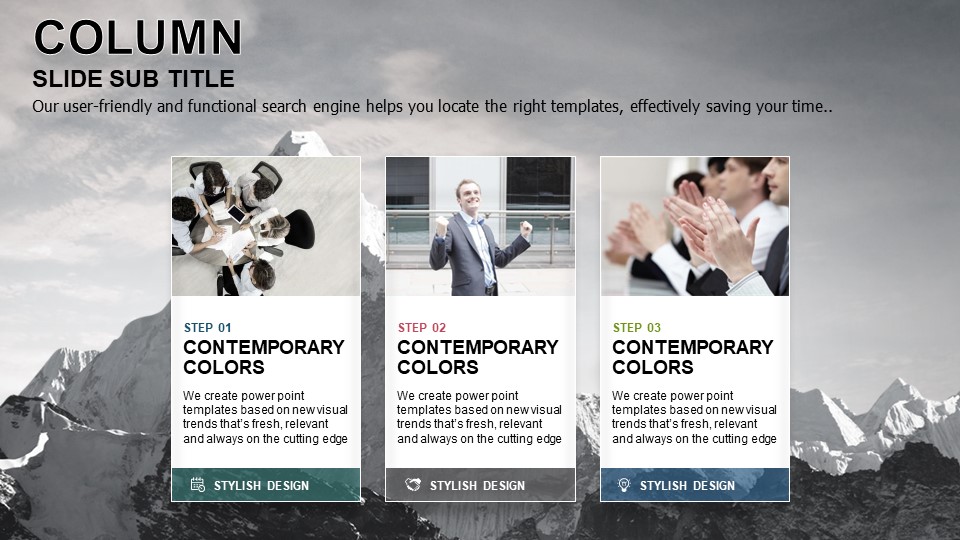
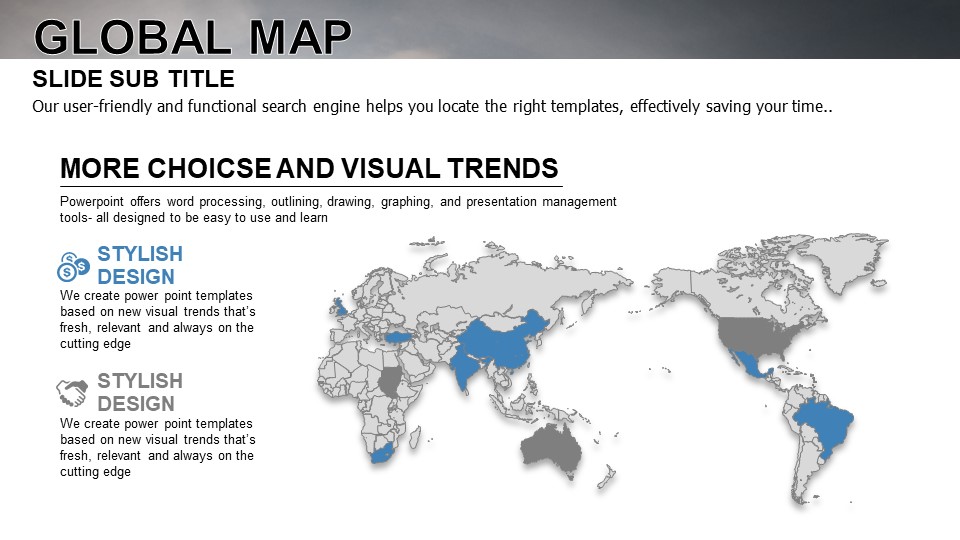
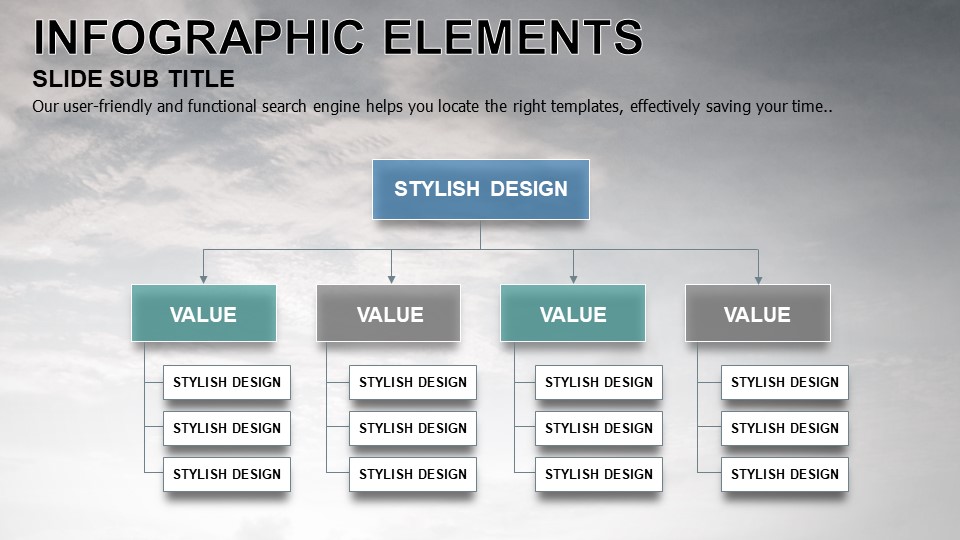
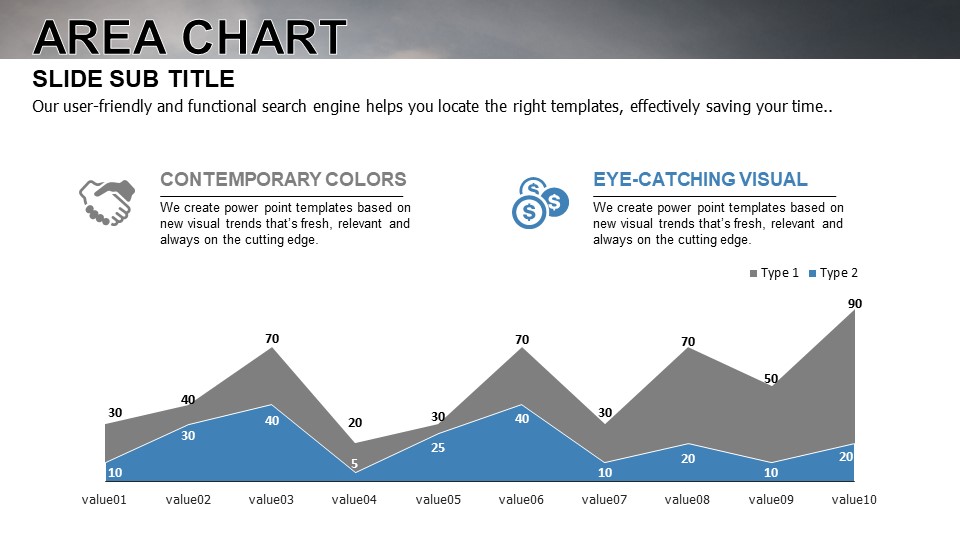
Includes a full-bleed victory photo cover slide, three-column card layout, circular infographic with icons, blue-highlighted global map, smartphone mockup with donut charts, and data comparison tables—35 slides in total.
Related Products
-

Ideas Conference Presentation Template – Stylish Business Design
#Business
-

Partnership PowerPoint Template – Ideal for Business Presentations
#Business
-

Success PowerPoint Wide Design – Professional and Modern Business Template
#Business
-

Entertainment Company Presentation Template – Stylish and Colorful Design
#Business
