Development Plan Cycle Diagram – Efficient Workflow
RJ0300029_19
- Last Update 04/25/2025
- File Size 1.5MB
- # of Slides 2
- File Format PPTX
- Slide Ratio 16:9
- Color
Keywords
- #Content-Based Slides
- #Design-Based Slides
- #Product/Service Introduction
- #Operational Plan
- #Diagram
- #Development Plan
- #Business Processes
- #Flow
- #Cluster
- #Circular Flow
- #Chain Diagram
- #16:9
- #cycle diagram PowerPoint
- #4-step circular diagram
- #process flow PowerPoint slide
- #development process diagram
- #diagram PowerPoint slide template
About the Product
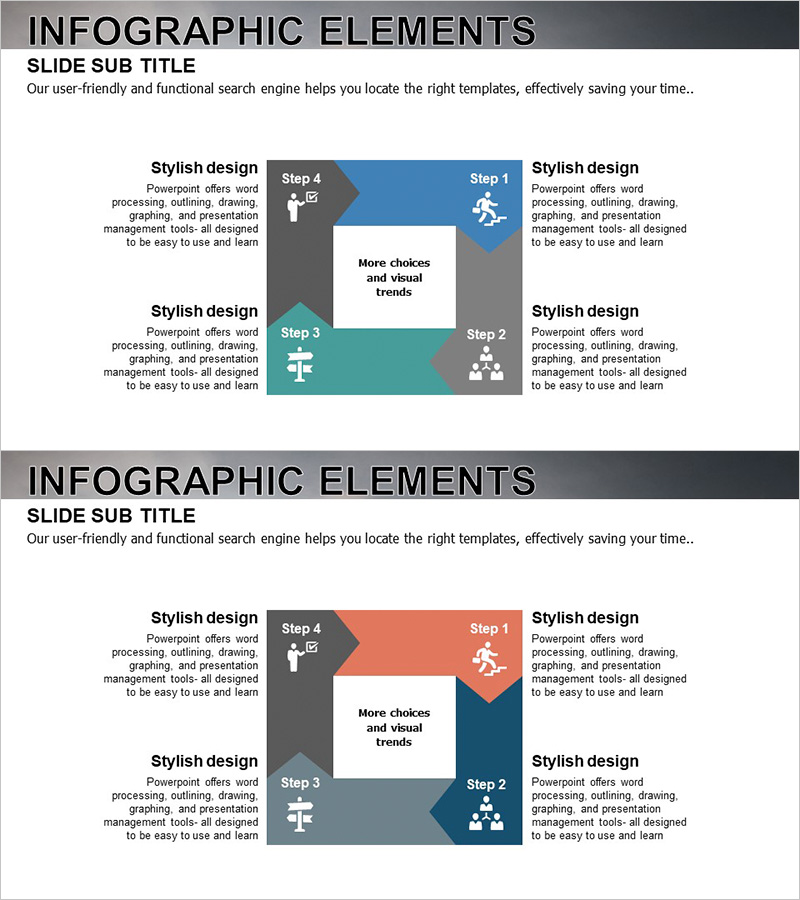
A 4-step circular diagram PowerPoint slide designed to visualize the sequential workflow of development projects. Arrow-shaped nodes in blue, gray, and teal colors connect clockwise to effectively represent repetitive processes and project cycles. Each step includes icons and text areas for clear communication of development planning, execution, review, and improvement phases. The 16:9 widescreen format with 2 slides is fully editable and ideal for project management presentations, quality improvement initiatives, and operational process briefings.
Usage Points
-
Main Usage
Optimized for visualizing sequential development workflows and repetitive project cycles. Clearly communicates planning→execution→review→improvement structures, making it effective for process improvement, quality management, and operational system presentations.
-
How to Use
Enter project phase names, responsible departments, and key activities in each step's text area. Icons can be customized to represent each phase's characteristics, and colors can be adjusted to distinguish priorities or categories. Suitable for presentations, reports, and training materials.
-
Recommended For
Recommended for project managers, development team leads, quality assurance specialists, and operations management departments. Particularly useful for software development lifecycle (SDLC), product development process, and continuous improvement program presentations.
-
Slide Structure
2-slide template. Each slide features 4 arrow-shaped nodes arranged clockwise around a central point in a circular structure. Nodes are color-coded: blue (Step 1), coral/orange (Step 4), teal (Step 3), and gray (Step 2), with icons and text input areas in each node.
Related Products
-

Work Principles & Collaboration Stack Slide – Dark & Light
#Business Strategy #Operational Plan #Diagram
-

Business Process Visualization Diagram Slide
#Operational Plan #Technical Approach #Diagram
-

Creative Connection Diagram – Product and Service Differentiation Strategy
#Product/Service Introduction #Operational Plan #Diagram
-

Square Circulatory System Diagram – Enhancing Operational Efficiency
#Operational Plan #Diagram #Business Processes
