Competitor Analysis Broken Line Graph – Market Trends and Vision
RJ0300029_18
- Last Update 04/25/2025
- File Size 2MB
- # of Slides 2
- File Format PPTX
- Slide Ratio 16:9
- Color
Keywords
- #Content-Based Slides
- #Design-Based Slides
- #Market and Competitor Analysis
- #Graph
- #Competitor Analysis
- #Industry Trends
- #Line
- #Line Chart
- #16:9
- #line chart PowerPoint slide
- #competitor analysis presentation
- #market trends template
- #dual-series line graph
- #business data visualization
- #line graph PowerPoint download
About the Product
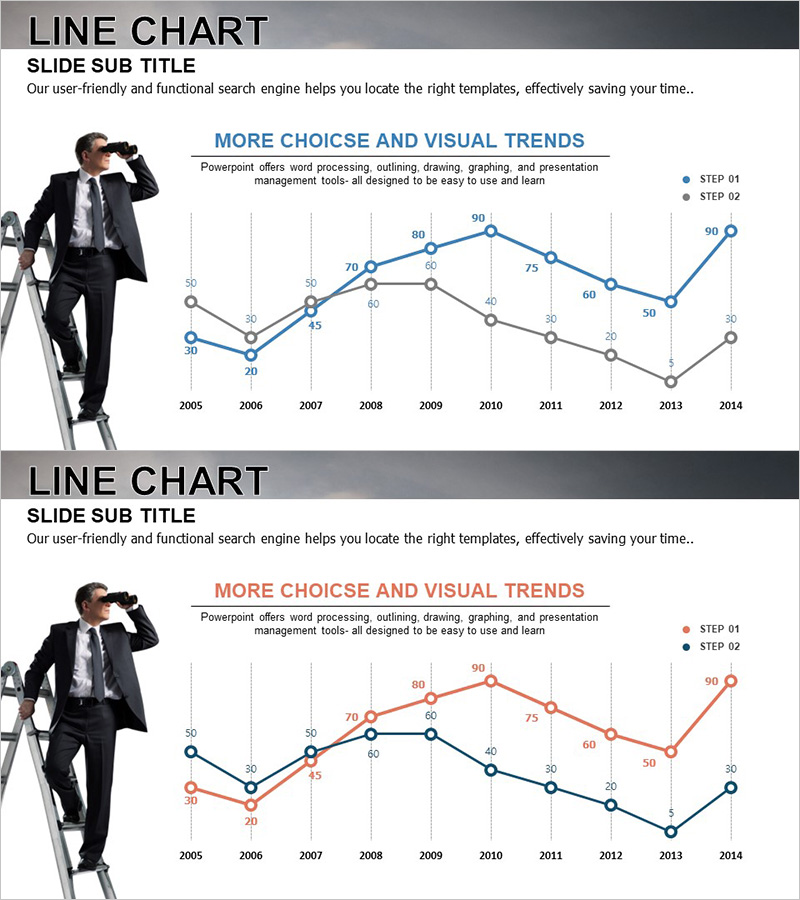
A dual-series line chart PowerPoint slide designed to visualize competitor analysis and market trends over time. This presentation template displays 10 years of data (2005–2014) using two trend lines in blue and gray tones, enabling clear comparison of competitive performance. Ideal for business presentations where you need to illustrate market share fluctuations, revenue trends, customer satisfaction metrics, or performance benchmarks across multiple entities. The 16:9 widescreen format includes 2 fully editable slides with data labels and legend indicators for maximum information clarity and professional impact.
Usage Points
-
Main Usage
Compare competitor performance against your own metrics over time using a dual-series line chart. This slide effectively displays market share evolution, revenue trajectories, customer satisfaction scores, brand awareness metrics, or any KPI requiring temporal comparison between two entities or datasets.
-
How to Use
Deploy in business strategy presentations, investor pitch decks, quarterly performance reports, and marketing strategy meetings during the competitive landscape analysis section. Simply relabel the legend items (STEP 01 and STEP 02) to represent your company and competitor, then replace sample data points with actual statistics for immediate use.
-
Recommended For
Strategy planners, marketing managers, executive presenters, business consultants, and investor relations professionals who need to communicate market analysis findings persuasively. Particularly suited for competitive advantage assessments, market share evolution tracking, and growth rate comparisons in high-stakes presentations.
-
Slide Structure
2-slide deck featuring dual-series line charts on each slide. Slide 1 uses blue and gray color schemes; Slide 2 employs orange and blue tones for visual variety across different data comparisons. Each chart contains 10 data points spanning 2005–2014, includes legend labels, numeric data markers, and features a professional businessman image on the left side for context and visual balance.
Related Products
-

Market Trend Analysis Charts & Diagrams – Essential Tool for Competitor Analysis
#Market and Competitor Analysis #Graph #Competitor Analysis
-

Market Trend Performance Trend Analysis Graph – Insights and Trends
#Market and Competitor Analysis #Graph #Competitor Analysis
-

Typographic Wide Template Line Chart – Effective Data Visualization for Market Analysis
#Market and Competitor Analysis #Diagram #Graph
-

Geometry Pattern Wide Line Chart PowerPoint Template - Market Trends and Competitor Analysis
#Market and Competitor Analysis #Graph #Competitor Analysis
