Business Understanding Cycle Diagram – Strategic Business Visualization
RJ0300029_24
- Last Update 04/26/2025
- File Size 2MB
- # of Slides 2
- File Format PPTX
- Slide Ratio 16:9
- Color
Keywords
- #Content-Based Slides
- #Design-Based Slides
- #Business Introduction
- #Business Vision and Strategy
- #Diagram
- #Business Overview
- #Business Understanding
- #Flow
- #Circular Flow
- #16:9
- #circular cycle diagram PowerPoint
- #3-stage cycle slide
- #business cycle diagram
- #cycle flow chart presentation
- #how to create cycle diagram in PowerPoint
About the Product
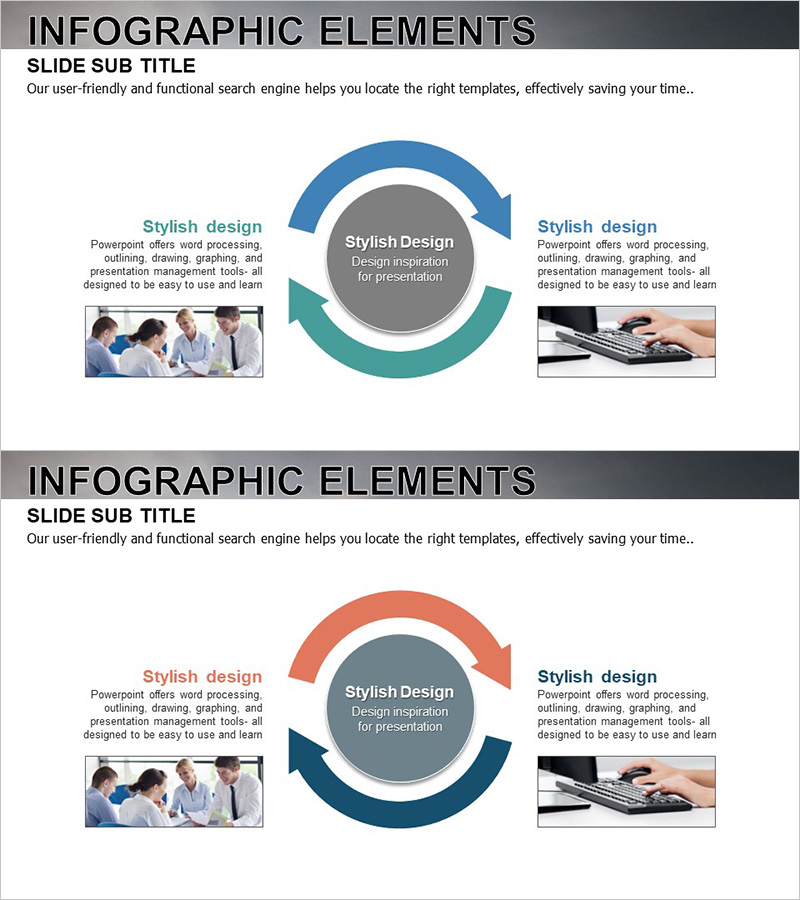
A 3-stage circular cycle diagram PowerPoint slide designed to visualize business understanding and strategic vision. The central gray circular hub is surrounded by blue and teal arrow-shaped segments that clearly represent cyclical flow and continuous processes. Each stage includes dedicated text areas and image placeholders, making it immediately applicable to business processes, strategy cycles, operational workflows, and product development narratives. The 2-slide set features alternate color combinations, optimized for 16:9 widescreen format. Perfect for presentations, business plans, and product introductions where circular relationships and iterative thinking need clear visual communication.
Usage Points
-
Main Usage
Visualizes cyclical business processes, strategy cycles, and operational workflows in three distinct stages. The clear hierarchy between the central hub and outer arrow segments effectively communicates the relationship between core concepts and supporting elements, emphasizing continuous improvement culture and iterative thinking in business presentations.
-
How to Use
Enter stage titles and descriptions in each arrow segment's text area, then insert relevant photos or icons in the image placeholders. Place key messages or logos in the central circular area to strengthen visual focus. Customize by adjusting colors, modifying arrow directions, or repositioning elements to match specific business contexts and presentation themes.
-
Recommended For
Ideal for executives and planning teams explaining cyclical business strategy, development teams visualizing product development cycles, operations teams presenting efficiency improvements, and investment pitch presentations emphasizing business model sustainability and continuous value creation.
-
Slide Structure
Three arrow-shaped segments (blue, teal, blue) arranged clockwise around a central gray circular hub. Each segment contains independent text input areas and image insertion spaces, with the overall layout emphasizing continuous cyclical flow. The 2-slide version provides alternate color combinations for diverse presentation contexts and visual preferences.
Related Products
-

Box Wide Template with Circular Diagram
#Business Introduction #Business Vision and Strategy #Business Strategy
-

Criminal Trial Diagram – Business Strategy and Overview
#Business Introduction #Business Vision and Strategy #Diagram
-

Business Overview Semicircle Diagram – Effective Business Delivery
#Company Introduction #Business Introduction #Business Vision and Strategy
-

Business Overview and Area Diagram – Blue and Orange
#Business Introduction #Business Vision and Strategy #Diagram
