Goal Achievement Status Graph – Visualizing Progress Towards Objectives
RJ0300029_5
- Last Update 04/26/2025
- File Size 1.6MB
- # of Slides 2
- File Format PPTX
- Slide Ratio 16:9
- Color
Keywords
- #Content-Based Slides
- #Design-Based Slides
- #Product/Service Introduction
- #Market and Competitor Analysis
- #Graph
- #Development Status
- #Market Share
- #Circles
- #Doughnut Chart
- #16:9
- #doughnut chart PowerPoint
- #pie chart slide template
- #goal achievement visualization
- #progress tracking slides
- #percentage comparison PPT
- #donut graph presentation
About the Product
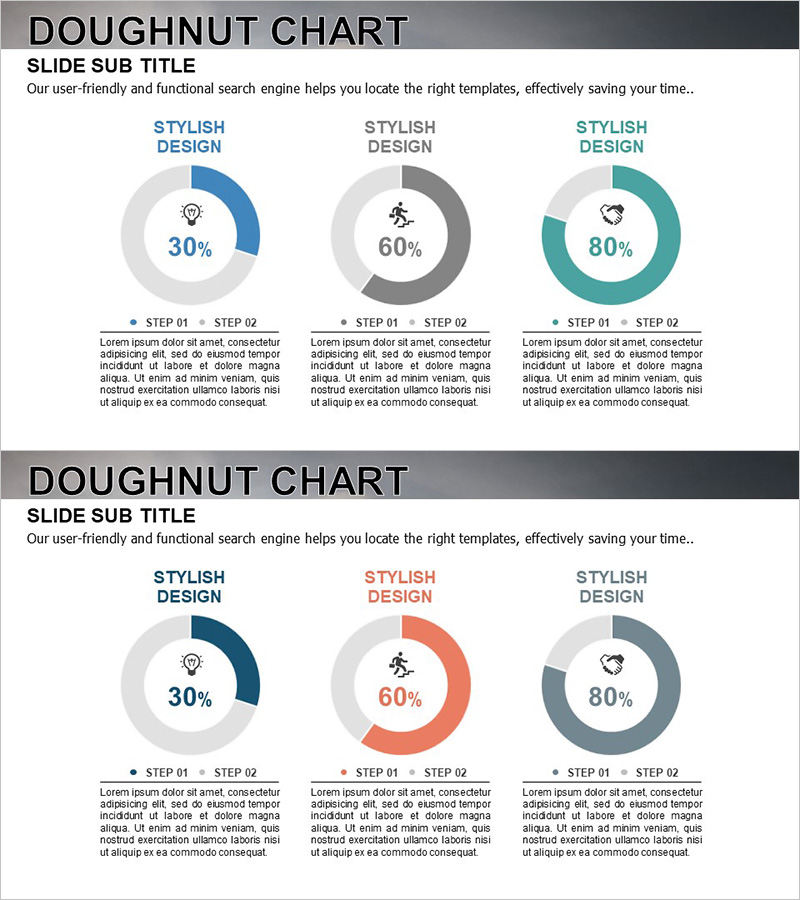
A 2-slide PowerPoint presentation featuring doughnut charts to visualize goal achievement status and progress tracking. The slides display three donut graphs in blue, gray, and teal colors showing 30%, 60%, and 80% completion rates side by side for easy comparison. Each chart includes a central icon (lightbulb, running figure, heart) and text areas labeled STEP 01 and STEP 02 below for detailed descriptions. Designed in 16:9 widescreen format and PPTX file type, these slides integrate seamlessly into modern presentation environments and allow quick data updates.
Usage Points
-
Main Usage
Effectively communicate project completion rates, business milestone progress, and performance metrics using donut chart visualization. The arc length of each doughnut intuitively represents percentage values, making it ideal for executive dashboards, quarterly performance reviews, and strategic planning presentations.
-
How to Use
Replace the percentage values in each doughnut chart with your actual data. Update the text boxes below each chart with item names and descriptions. Customize colors to match your corporate branding, and swap icons for other symbols to clarify categories. Duplicate the 2-slide set to compare multiple metrics simultaneously.
-
Recommended For
Project managers, business analysts, marketing directors, finance professionals, and executives presenting quarterly results, budget allocation rates, customer satisfaction scores, and project milestone tracking to stakeholders.
-
Slide Structure
Both slides follow identical layout: title area at top + three doughnut charts displaying 30%, 60%, and 80% + centered icon in each chart + STEP 01 and STEP 02 text explanation areas below. 16:9 widescreen ratio, fully editable PPTX format.
Related Products
-

Analysis of Work Progress – Utilizing Pie Chart
#Product/Service Introduction #Market and Competitor Analysis #Graph
-

Analysis of Transportation Usage Status – Pie Chart
#Product/Service Introduction #Market and Competitor Analysis #Graph
-

Financial Business Analysis Pie Chart – Market Share Insights
#Product/Service Introduction #Market and Competitor Analysis #Graph
-

Stock Market Share Analysis Graph – Insights and Strategies
#Product/Service Introduction #Market and Competitor Analysis #Graph
