Market Analysis Round Bar Graph – Effective Tool for Market and Competitor Analysis
RJ0300029_6
- Last Update 04/26/2025
- File Size 1.5MB
- # of Slides 2
- File Format PPTX
- Slide Ratio 16:9
- Color
Keywords
- #Content-Based Slides
- #Design-Based Slides
- #Market and Competitor Analysis
- #Graph
- #Competitor Analysis
- #Market Analysis
- #Column
- #Column Chart
- #Grouped Column
- #16:9
- #grouped column chart PowerPoint
- #market analysis slide template
- #comparison chart PowerPoint
- #data visualization graph
- #competitor analysis presentation slide
About the Product
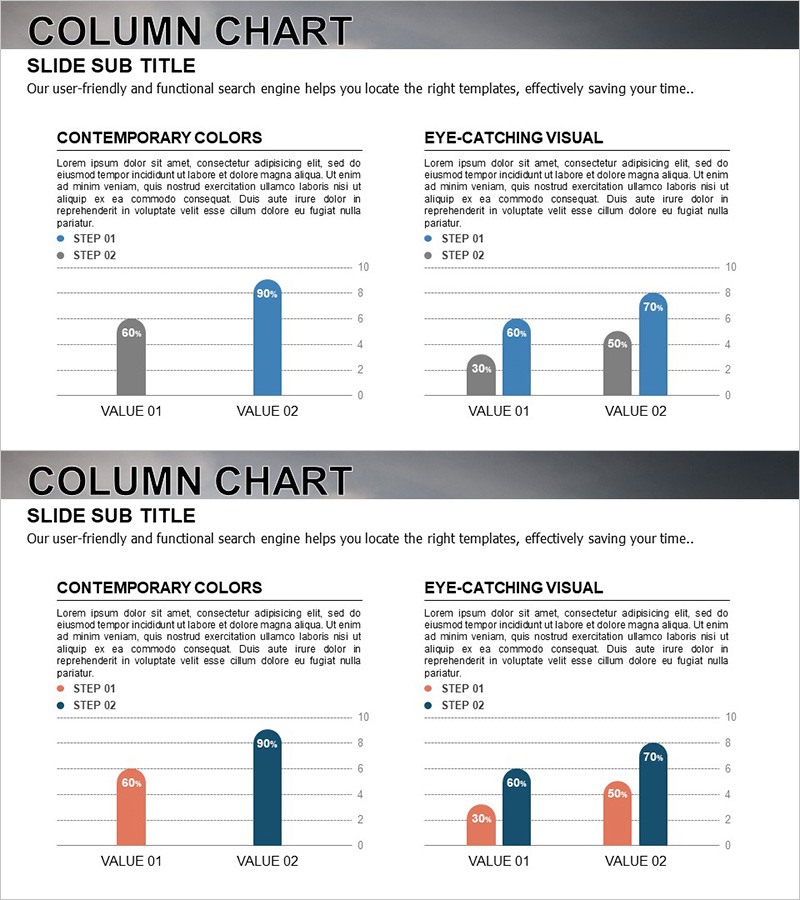
A grouped column chart PowerPoint slide designed for market analysis and competitor comparison presentations. This template features two data series displayed side-by-side using a gray and blue color palette to clearly distinguish between comparison categories. Each slide includes a title area, legend, gridlines, and percentage labels for professional data representation. Formatted in 16:9 PPTX for modern presentation environments, this slide effectively communicates numerical comparisons and market insights with visual clarity.
Usage Points
-
Main Usage
Displays two data series side-by-side to compare market size, competitor performance, sales figures, or growth metrics. The gray and blue color scheme provides clear visual distinction between data categories, while percentage labels communicate ratio information simultaneously with absolute values.
-
How to Use
Insert into business proposals, marketing plans, and quarterly reports in the market analysis section. Edit bar heights and values with your own data, customize title and legend text, and deploy immediately. Two slide layouts accommodate multiple comparison scenarios and data sets.
-
Recommended For
Marketing professionals, executives, management consultants, and sales teams presenting market conditions and competitive positioning. Ideal for investor pitch decks, business planning sessions, quarterly performance reviews, and data-driven decision-making presentations.
-
Slide Structure
Each slide divides into two sections: 'Contemporary Colors' (left) and 'Eye-Catching Visual' (right). Within each section, two bars (gray and blue) compare VALUE 01 and VALUE 02 against a 0-10 Y-axis scale with gridlines and percentage labels for precise data communication.
Related Products
-

Eco-friendly Business Project Goal Market Strategy – Visualizing the Market Analysis
#Market and Competitor Analysis #Graph #Competitor Analysis
-

Modern Business Plan Template – Clustered Column Graph
#Market and Competitor Analysis #Graph #Market Analysis
-

AI Business Market Analysis Bar Graph – Key Statistics and Insights
#Market and Competitor Analysis #Graph #Competitor Analysis
-

Logistics Performance Comparison Chart – Market and Competitor Analysis
#Market and Competitor Analysis #Graph #Competitor Analysis
