Business Goal Achievement Status Pie Chart
RJ0300029_27
- Last Update 04/26/2025
- File Size 1.7MB
- # of Slides 2
- File Format PPTX
- Slide Ratio 16:9
- Color
Keywords
- #Content-Based Slides
- #Design-Based Slides
- #Product/Service Introduction
- #Business Introduction
- #Graph
- #Development Status
- #Technological Status
- #Circles
- #Doughnut Chart
- #16:9
- #doughnut chart PowerPoint slide
- #donut chart template
- #percentage ratio visualization
- #business goal achievement PPT
- #pie chart PowerPoint template
- #data visualization slide design
About the Product
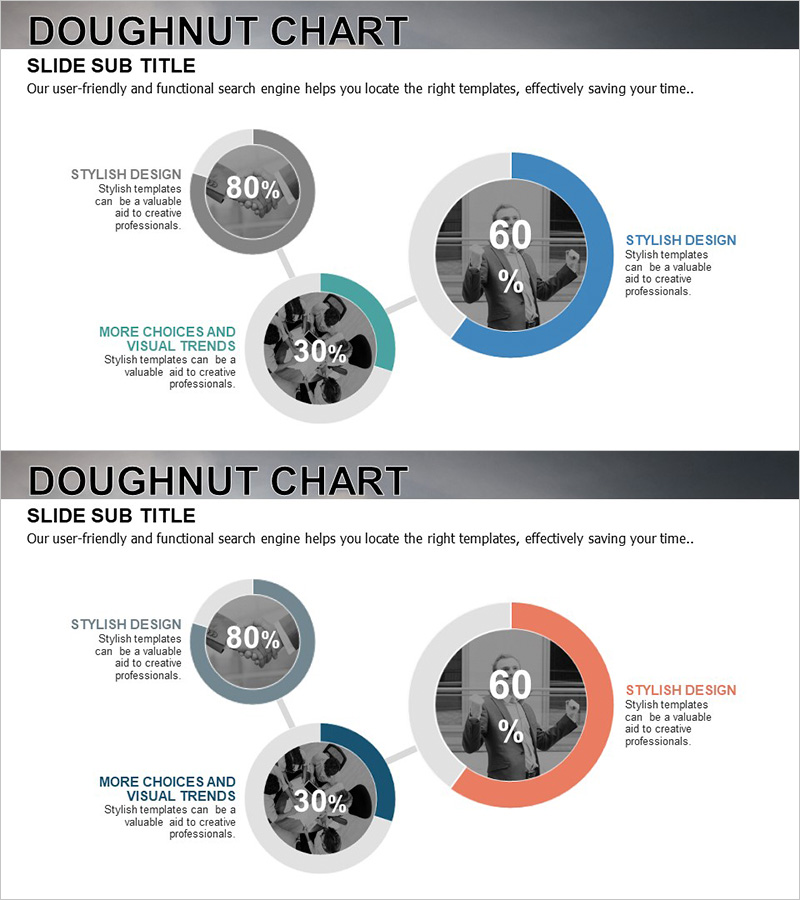
A professional doughnut chart PowerPoint slide designed to visualize business goal achievement status and performance metrics. This presentation template features two doughnut chart layouts with blue, gray, and turquoise color schemes, each displaying percentage data with a central image area for contextual photos. The 16:9 widescreen PPTX format is fully editable and ready to use for technology status updates, development progress reports, and performance presentations across various business contexts.
Usage Points
-
Main Usage
Effectively communicate achievement rates, technology implementation status, and project completion percentages using doughnut chart visualization. The central image area allows you to insert relevant photos that reinforce data context and enhance audience engagement with visual storytelling.
-
How to Use
Replace the percentage values and labels in each doughnut chart with your actual data. Insert relevant images into the central areas of the charts, and add descriptive text in the left text zones to provide context. This combination of quantitative visualization and qualitative explanation creates a compelling, professional presentation slide.
-
Recommended For
Ideal for business performance reports, technology development status presentations, marketing campaign results analysis, and project completion rate updates. Perfect for executives, team leads, project managers, and department heads presenting quantitative achievements to stakeholders.
-
Slide Structure
Two-slide template with one doughnut chart per slide. The primary doughnut chart (center, 60% data) is prominently sized, while two secondary charts (80% and 30%) are positioned on the left. Each chart includes a dedicated central image insertion area. The blue, gray, and turquoise color palette conveys professionalism and credibility.
Related Products
-

Visualizing Military Data with Donut Chart – Power of Trust
#Product/Service Introduction #Business Introduction #Diagram
-

Financial Management Analysis Status Graph
#Product/Service Introduction #Business Introduction #Graph
-

Business Analysis with Doughnut Chart – Dawn City Theme
#Product/Service Introduction #Business Introduction #Diagram
-

Business Project Development Status Analysis Graph
#Product/Service Introduction #Business Introduction #Graph
