Goal Achievement Analysis Area Graph – Data-driven Competitive Edge
RJ0300029_32
- Last Update 04/26/2025
- File Size 2.2MB
- # of Slides 2
- File Format PPTX
- Slide Ratio 16:9
- Color
Keywords
About the Product
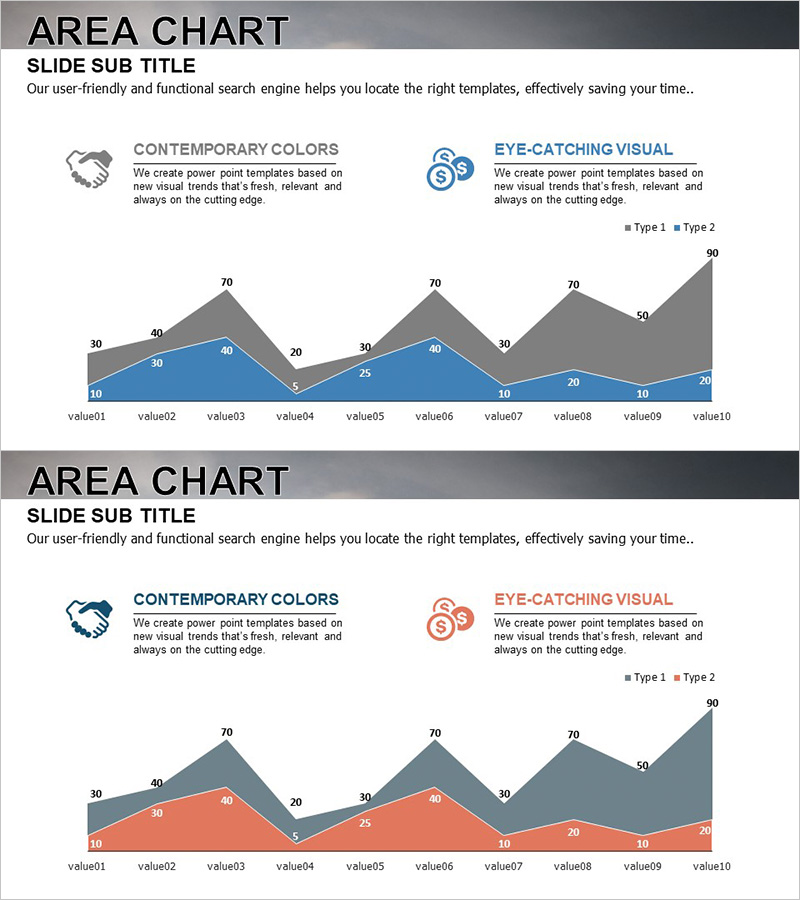
A dual-series area chart PowerPoint slide designed for goal achievement analysis and performance tracking. Two overlapping areas (blue and gray) visualize data trends across 10 data points, enabling simultaneous comparison and trend analysis. Contemporary color palette combined with icon-based section descriptions emphasizes data credibility and is immediately applicable to competitive analysis, market performance comparison, and goal-versus-actual reporting. Two-slide set provides color variations (blue and orange tones) for flexible document styling.
Usage Points
-
Main Usage
Expresses two data series as overlapping areas to simultaneously visualize trend changes over time and relationships between metrics. Optimized for communicating comparative analysis data such as goal-versus-actual performance, company performance versus competitors, and market share evolution with intuitive visual impact.
-
How to Use
Modify the section title and icons at the top to match document context, then replace data values (30–90 range) with actual figures. Update the legend (Type 1 and Type 2) with comparison subject names, and optionally switch colors to orange or gray tones before inserting into your presentation.
-
Recommended For
Ideal for finance, strategy, and marketing professionals preparing executive reports, business performance presentations, marketing analysis documents, investor briefings, and competitive analysis reports. Particularly effective for visualizing quarterly and annual performance trends in executive dashboards and strategic reviews.
-
Slide Structure
Two-slide set, each containing a dual-series area chart with 10 data points (value01–value10). First slide features blue and gray color combination; second slide offers orange and gray variation. Icon and section description text area positioned at the top of each slide for flexible customization.
Related Products
-

Competitor Analysis Comparison Area Graph – Visualizing Competitive Edge Data
#Market and Competitor Analysis #Graph #Other
-

Business Program Analysis Area Graph – Competitive Edge
#Market and Competitor Analysis #Diagram #Graph
-

Comparative Analysis Mobile Phone Mockup Graph – Market Competitive Advantage
#Market and Competitor Analysis #Other #Competitor Analysis
-

Monthly Volume Overview Area Chart – Essential Tool for Market Analysis
#Market and Competitor Analysis #Graph #Competitor Analysis
