Market Analysis Bar Graph – Effective Visualization for Competitor Analysis
RJ0300029_15
- Last Update 04/25/2025
- File Size 1.5MB
- # of Slides 2
- File Format PPTX
- Slide Ratio 16:9
- Color
Keywords
- #Content-Based Slides
- #Design-Based Slides
- #Market and Competitor Analysis
- #Graph
- #Competitor Analysis
- #Market Analysis
- #Horizontal Bar
- #Segmented Horizontal Bar
- #16:9
- #horizontal bar chart PowerPoint
- #competitor analysis slide template
- #market analysis presentation
- #bar graph template download
- #comparison chart PPT
About the Product
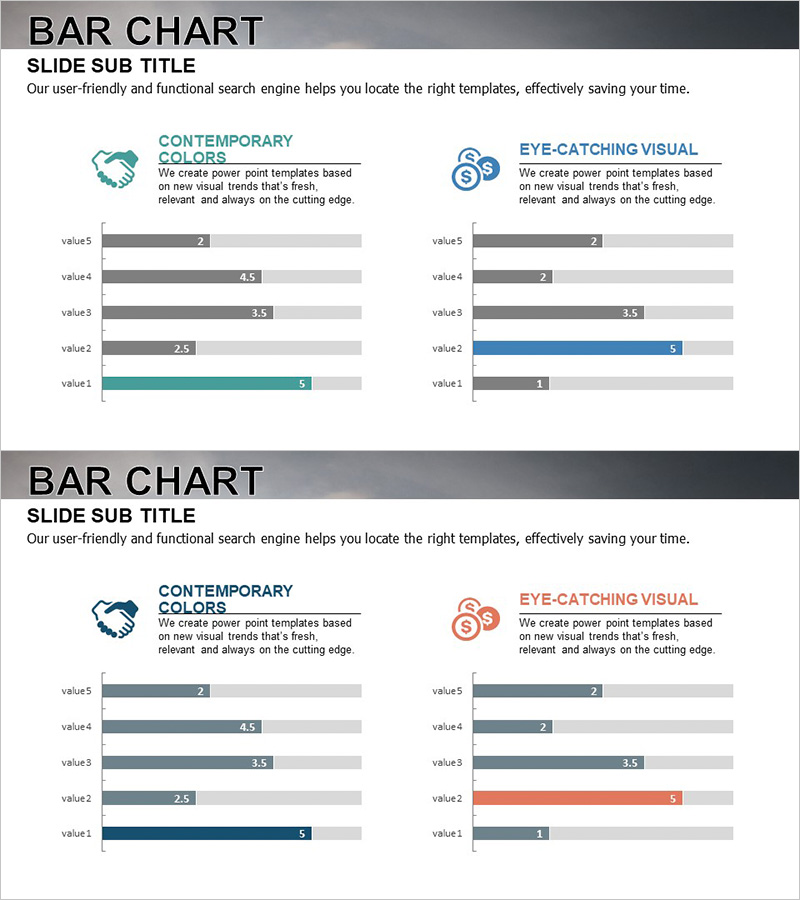
A horizontal bar chart PowerPoint slide optimized for market analysis and competitor comparison presentations. This 2-slide template features two design variations: the first with teal accent colors and the second with blue accents, both using contemporary color palettes. Each slide displays five data items (value1 through value5) arranged horizontally, enabling intuitive visualization of comparative metrics. Ideal for company performance reports, product feature comparisons, market share analysis, competitive positioning, and other business presentations requiring clear numerical data visualization.
Usage Points
-
Main Usage
Visualize competitor performance metrics, market share distribution, product feature comparisons, sales performance rankings, and other quantitative data where horizontal bar length directly represents comparative magnitude across multiple categories.
-
How to Use
Replace each value label with your comparison categories (competitor names, product names, regions, etc.) and update numerical values. Bar lengths automatically adjust proportionally. Select either the teal or blue color variation based on your presentation theme and corporate branding.
-
Recommended For
Marketing professionals presenting market analysis, sales teams reporting competitive positioning, executive strategy meetings, investor pitch decks, product management teams comparing feature sets, and business analysts presenting comparative performance data.
-
Slide Structure
2-slide template with consistent layout: title area at top, left panel containing icon and descriptive text, right panel with 5-item horizontal bar chart. Bars display against gray background with accent color (teal or blue) data representation, numerical labels positioned at bar endpoints.
Related Products
-

Chemical Experiment Analysis Horizontal Bar Graph
#Market and Competitor Analysis #Graph #Competitor Analysis
-

Body Organ Analysis Subdivision Graph - Market and Competitor Comparison
#Market and Competitor Analysis #Graph #Competitor Analysis
-

VR Market Analysis Bar Graph – Understanding Competitive Landscape
#Market and Competitor Analysis #Graph #Competitor Analysis
-

Segmented Graph of Learning Goal Achievement – Market and Competitor Analysis
#Market and Competitor Analysis #Graph #Competitor Analysis
