Step-by-step Business Objectives Diagram – Execution Roadmap for Vision Realization
RJ0300029_22
- Last Update 04/26/2025
- File Size 1.6MB
- # of Slides 2
- File Format PPTX
- Slide Ratio 16:9
- Color
Keywords
- #Content-Based Slides
- #Design-Based Slides
- #Product/Service Introduction
- #Business Vision and Strategy
- #Diagram
- #Features
- #Business Goals
- #Flow
- #Cluster
- #Linear Flow
- #Chain Diagram
- #16:9
- #business objectives diagram PowerPoint
- #step-by-step goals presentation slide
- #connection diagram template
- #vision realization roadmap PPT
- #goal achievement process slide
About the Product
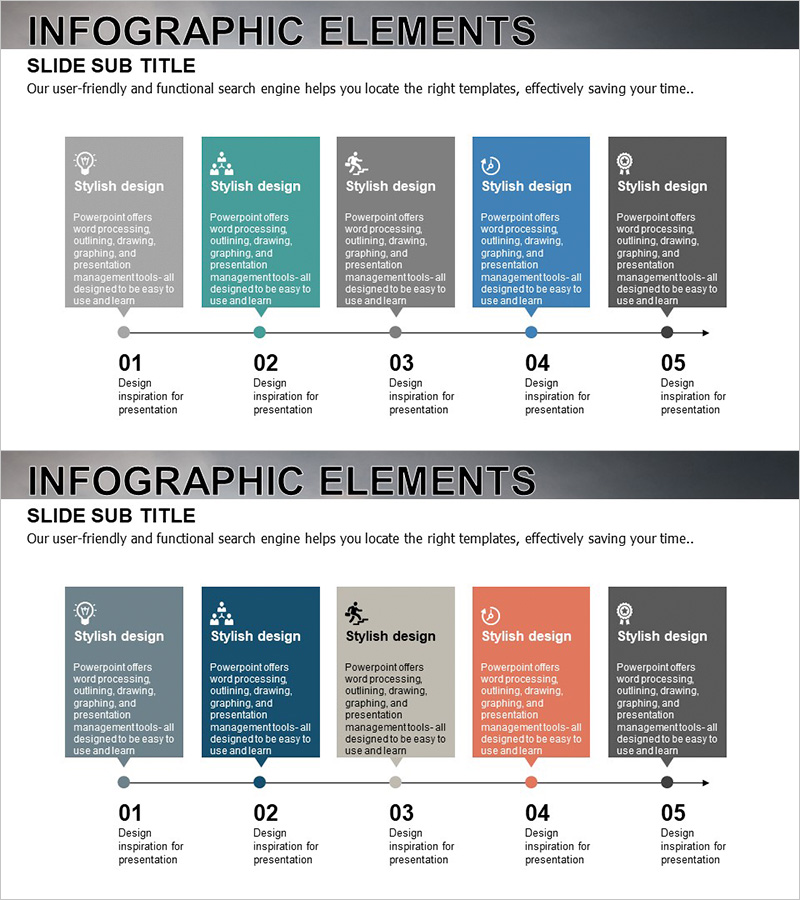
A connection diagram PowerPoint slide that visualizes business objectives across five sequential steps. Each stage is represented with icons and text boxes, connected by arrows to clearly show the flow of goal achievement. The multi-color palette—gray, teal, blue, and black—distinguishes the importance of each step. This presentation slide is ready to use for strategic planning, execution roadmaps, and phased objective setting in management presentations. Composed of 2 slides in 16:9 widescreen format, all elements are fully editable to customize the goal structure for your organization.
Usage Points
-
Main Usage
Breaks down organizational long-term vision into phased business objectives and communicates them visually. Enables executives, managers, and employees to understand the goal achievement flow at a glance. Ideal for strategic planning presentations, business plan announcements, and organizational goal-sharing sessions.
-
How to Use
Input your organization's actual objectives, challenges, and implementation strategies into each step's text box. Customize colors and icons to match your corporate brand for a cohesive presentation. Add slide animations to reveal each step sequentially, increasing audience engagement and comprehension.
-
Recommended For
Recommended for executives, strategy planning teams, business development teams, marketing teams, and HR departments responsible for organizational strategy formulation and communication. Suitable for new employee orientation, quarterly business objective presentations, mid-to-long-term management plan briefings, and investor vision pitches.
-
Slide Structure
Two-slide composition. The first slide features five nodes connected left-to-right by arrows in a linear flow structure. Each node includes an icon, title, and descriptive text. The second slide presents a variation with different color combinations to accommodate diverse presentation scenarios. Optimized for modern presentation environments in 16:9 widescreen format.
Related Products
-

Medical Business Process Diagram – Maximizing Efficiency
#Business Vision and Strategy #Diagram #Business Strategy
-

Key Outcomes from Experimentation – Vision and Strategy
#Business Vision and Strategy #Diagram #Business Goals
-

Step-by-Step Pathway to the Final Learning Goal
#Business Vision and Strategy #Technical Approach #Diagram
-

Functional Value Proposition Slide – Business Strategy Presentation
#Business Vision and Strategy #Diagram #Business Strategy
