Company Key Financial Indicators Table Slide
RJ0300029_9
- Last Update 04/26/2025
- File Size 1.5MB
- # of Slides 2
- File Format PPTX
- Slide Ratio 16:9
- Color
Keywords
- #Content-Based Slides
- #Design-Based Slides
- #Market and Competitor Analysis
- #Financial Plans and Performance
- #Diagram
- #Market Analysis
- #Key Financial Indicators
- #Table
- #Standard Table
- #16:9
- #table diagram PowerPoint
- #financial indicators slide template
- #data table presentation
- #comparison table PowerPoint download
- #financial report slide design
About the Product
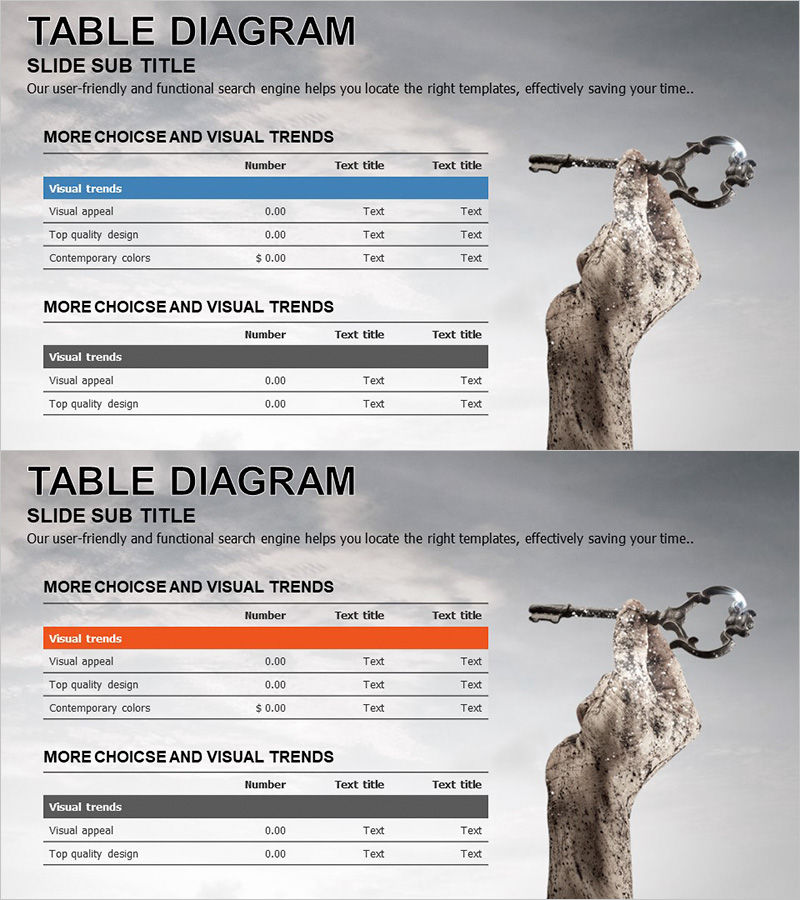
A professional table-format PowerPoint slide designed to present key financial metrics and performance data clearly. The slide features a 3-column by 4-row data table with color-coded header rows (blue, orange, and gray) that emphasize visual hierarchy and information structure. The 2-slide set offers multiple color combinations for flexible application across different sections. The right-side image area is optimized for brand visuals, product photography, or additional graphics. Ready to use for financial reports, investor presentations, market analysis, and performance reviews requiring quantitative data visualization.
Usage Points
-
Main Usage
Present quantitative data such as financial metrics, sales performance, market share, and KPIs in a structured table format. The color-coded header rows create clear information hierarchy, improving audience comprehension and retention. The right-side image area reinforces brand credibility and visual impact.
-
How to Use
Slide 1 features a blue header; Slide 2 offers orange and gray header options for different sections. Edit table cells directly to input your actual financial data and numbers. Insert company logos, product images, or relevant graphics in the right-side image area to enhance visual completeness and brand consistency.
-
Recommended For
Finance professionals, executives, investor relations managers, and business analysts presenting quarterly or annual financial results. Ideal for business plans, investor pitch decks, performance reports, marketing proposals, and any corporate presentation requiring quantitative evidence and data-driven storytelling.
-
Slide Structure
2-slide set. Each slide includes a title area, 3-column by 4-row data table with header row, and a right-side image placement area. Slide 1 uses blue header styling; Slide 2 provides orange and gray header options for design variety. Optimized for 16:9 widescreen format.
Related Products
-

Business Plan Presentation Template - Radial Diagram & Table
#Market and Competitor Analysis #Financial Plans and Performance #Diagram
-

Subdivided Graphs and Tables Slide – Market Analysis and Performance Data
#Market and Competitor Analysis #Financial Plans and Performance #Diagram
-

Modern Business Plan Presentation Template Text Diagram – Financial Performance and Budget Management
#Financial Plans and Performance #Diagram #Budget
-

Square Frame Presentation Template for Financial Performance – Efficiency and Clarity
#Financial Plans and Performance #Diagram #Cash Flow Statement
