Modern IR PPT Template – Professional and Sleek Design
M0600006
- Last Update 01/22/2025
- File Size 30MB
- # of Slides 33
- File Format PPTX
- Slide Ratio 16:9
- Color
Slide Preview


Keywords
About the Product
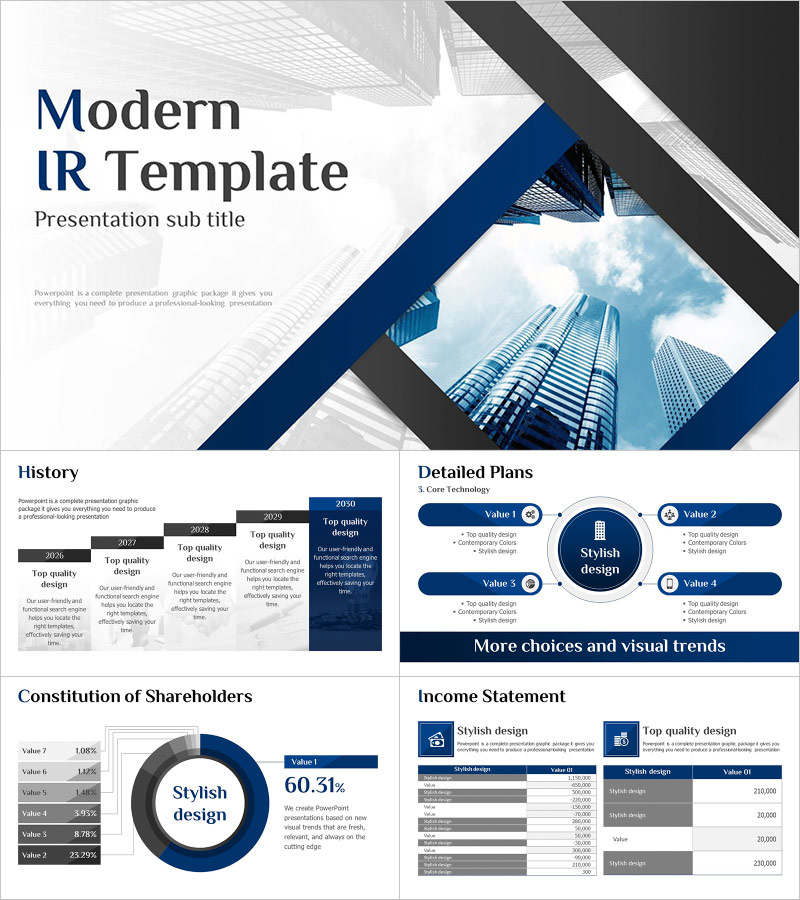
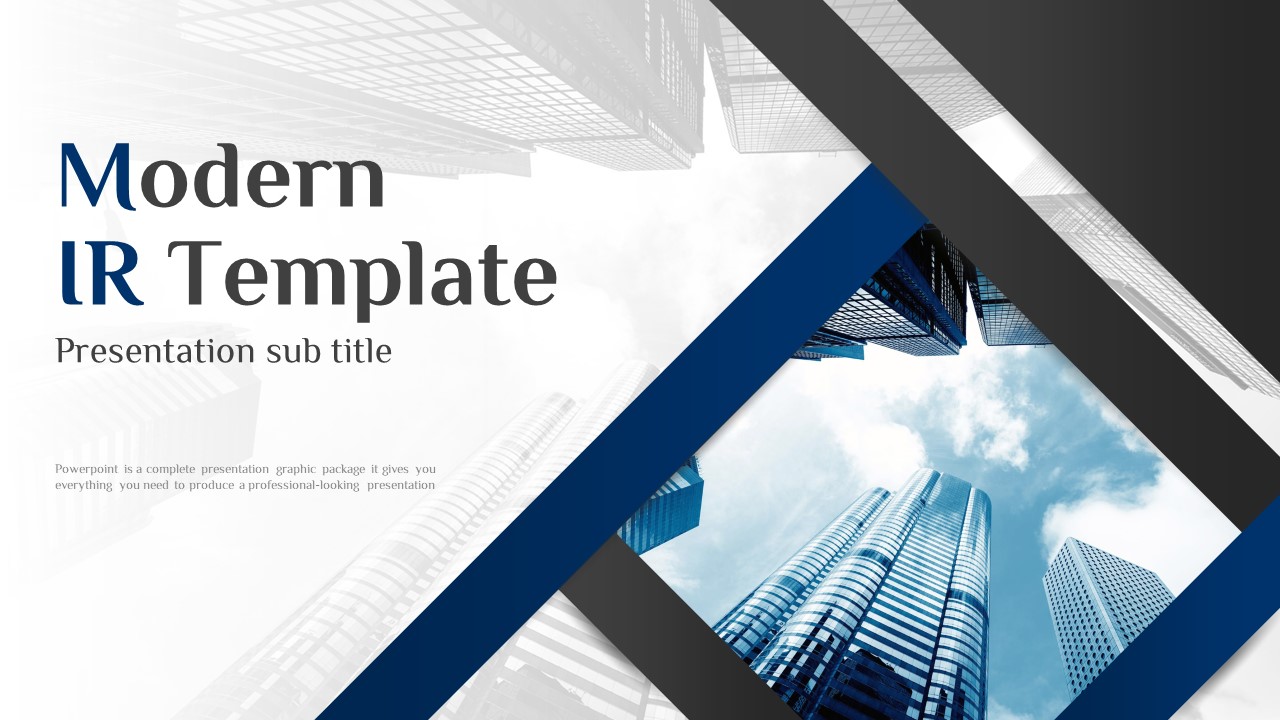
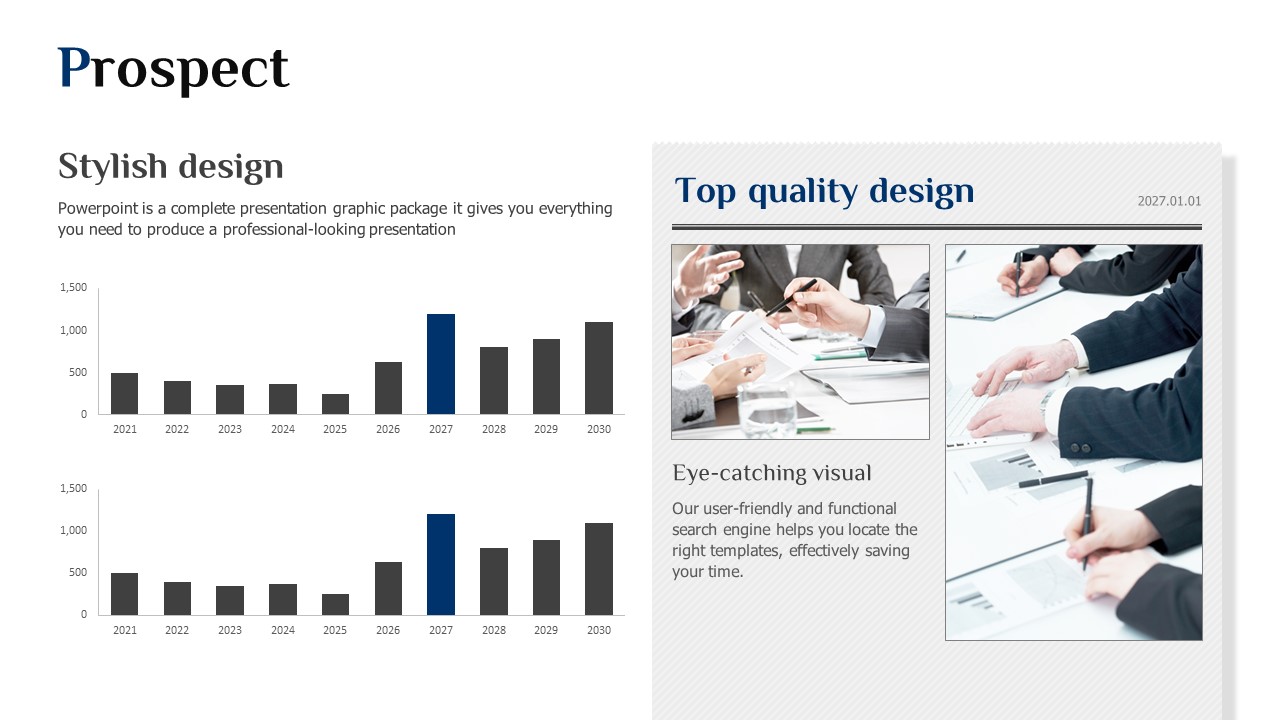
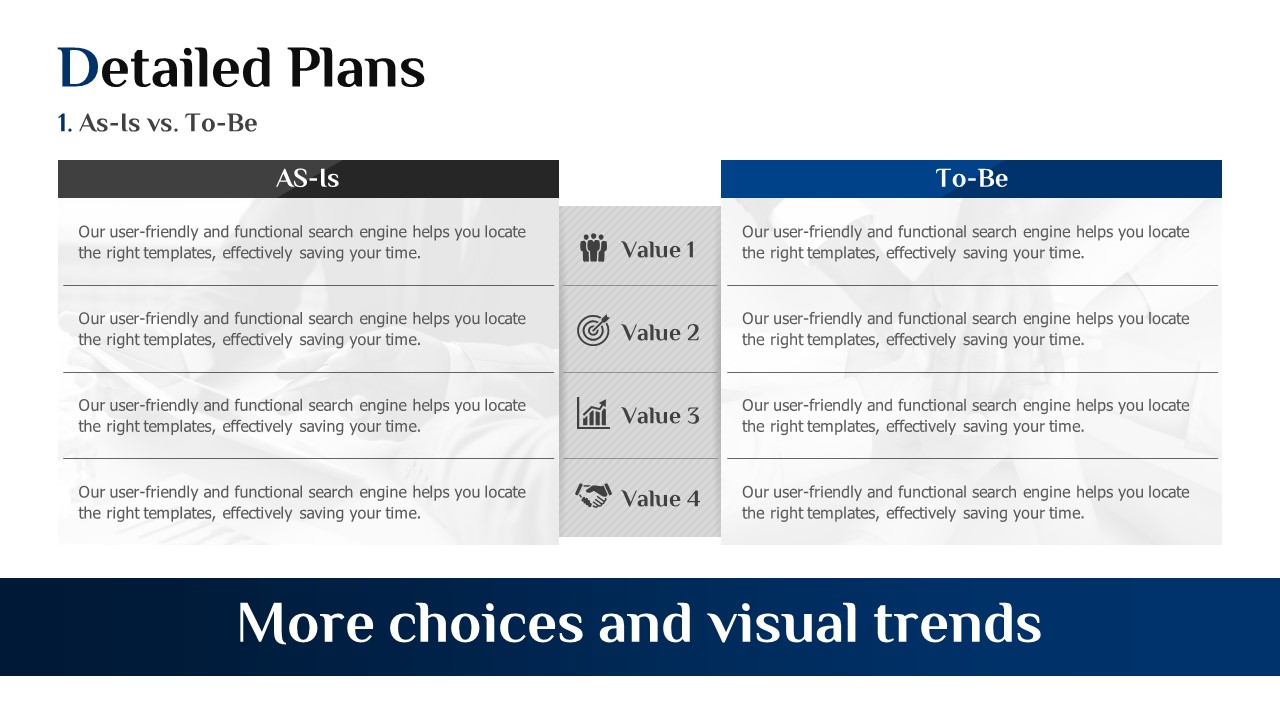
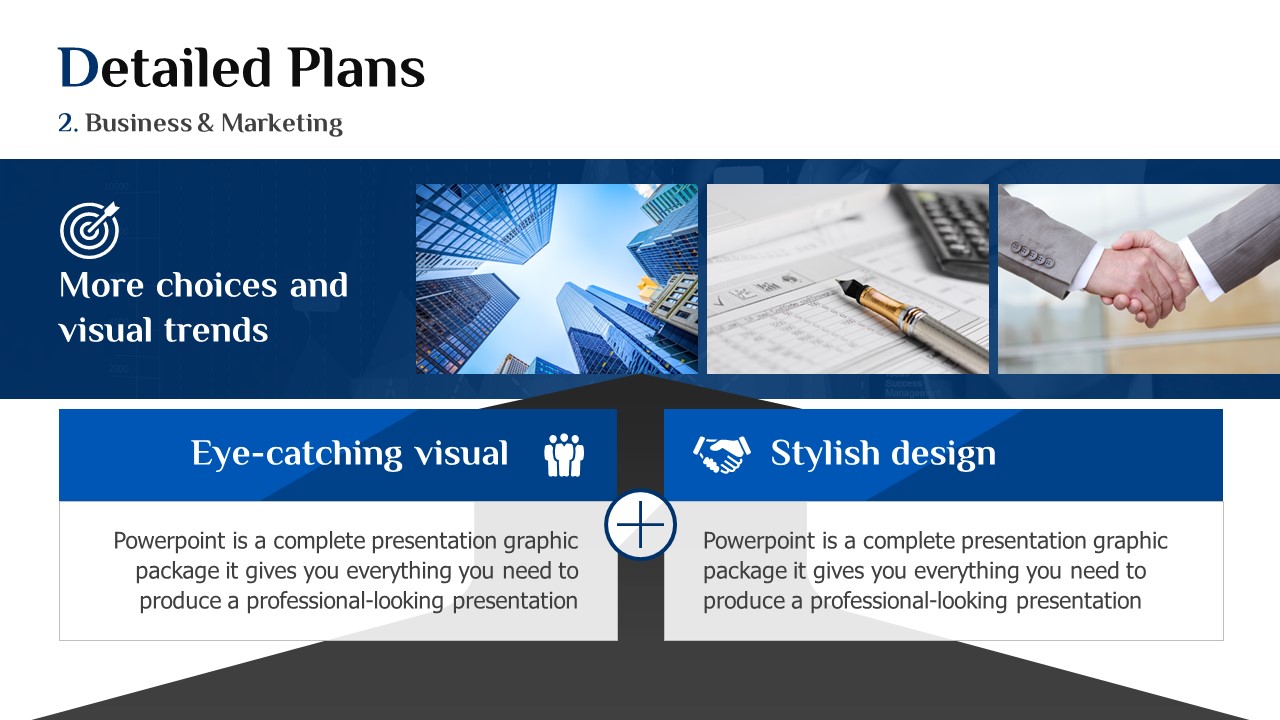
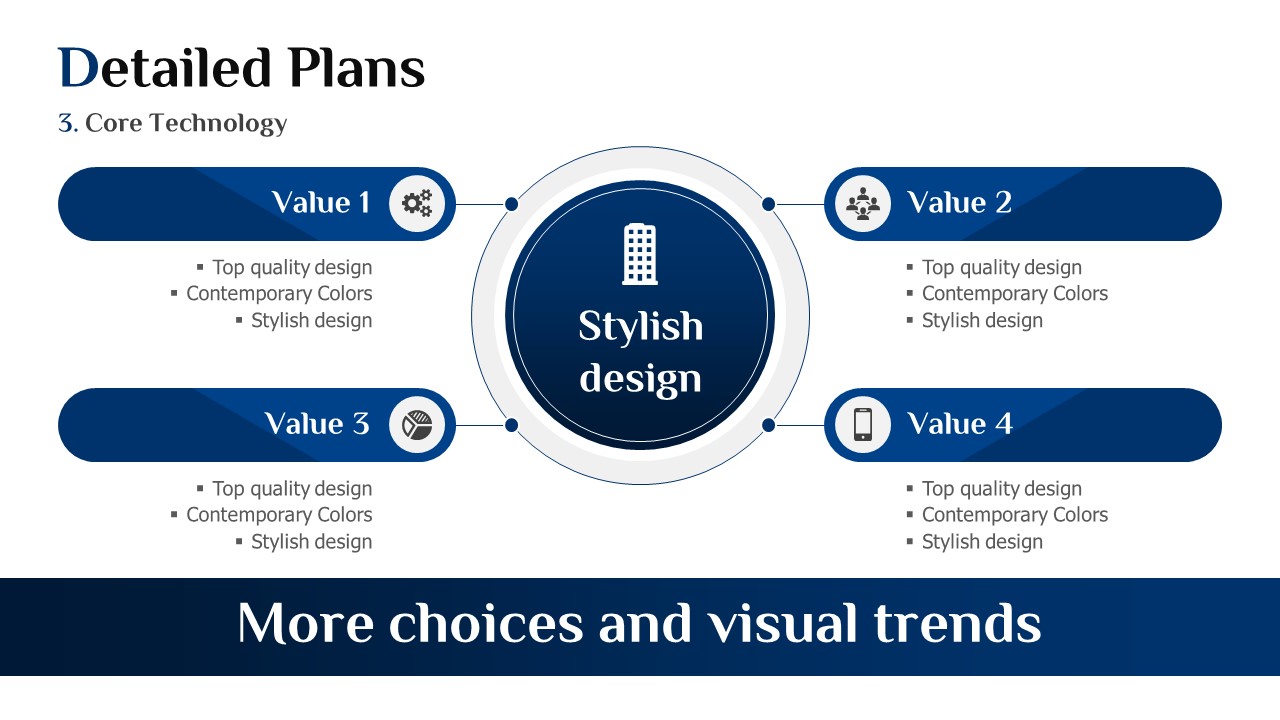
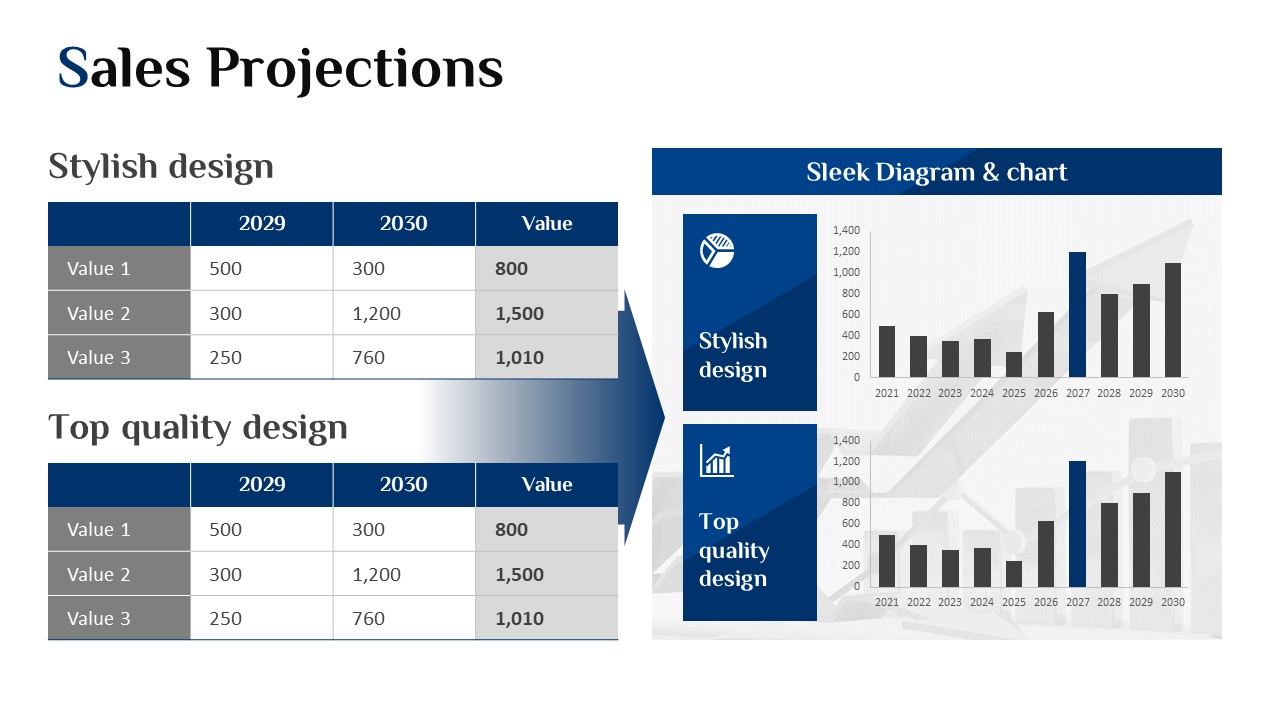
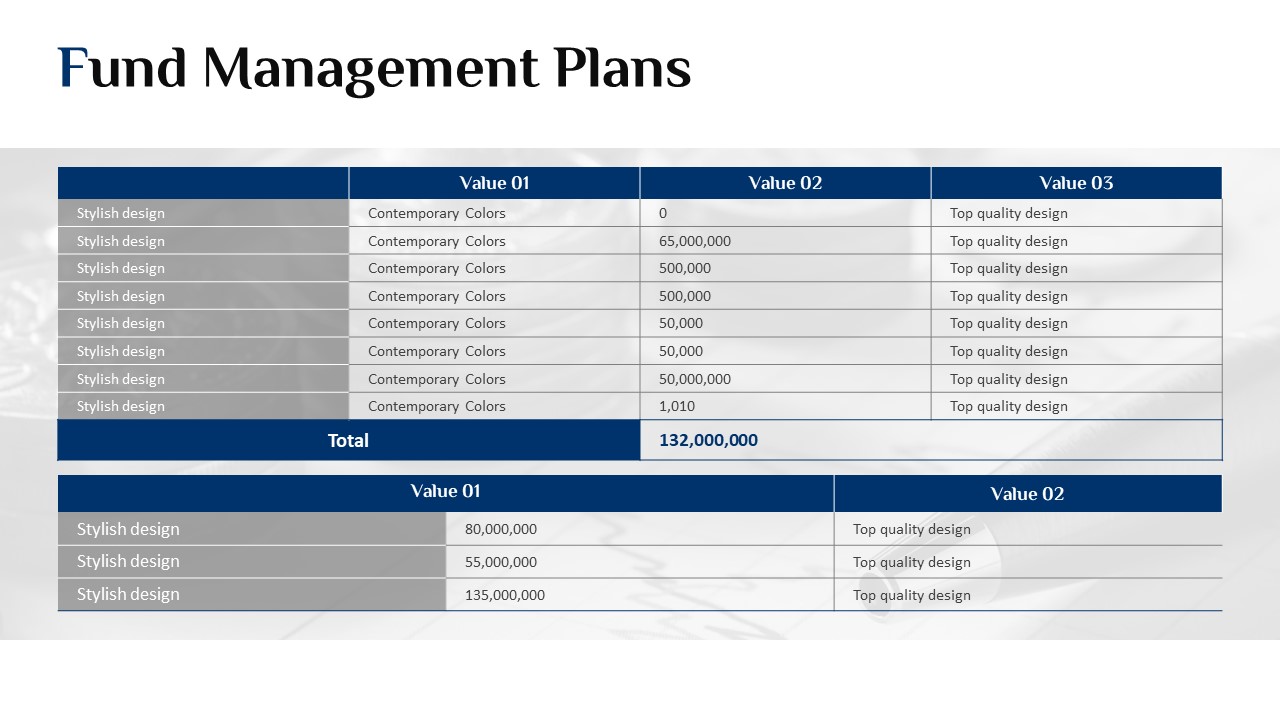
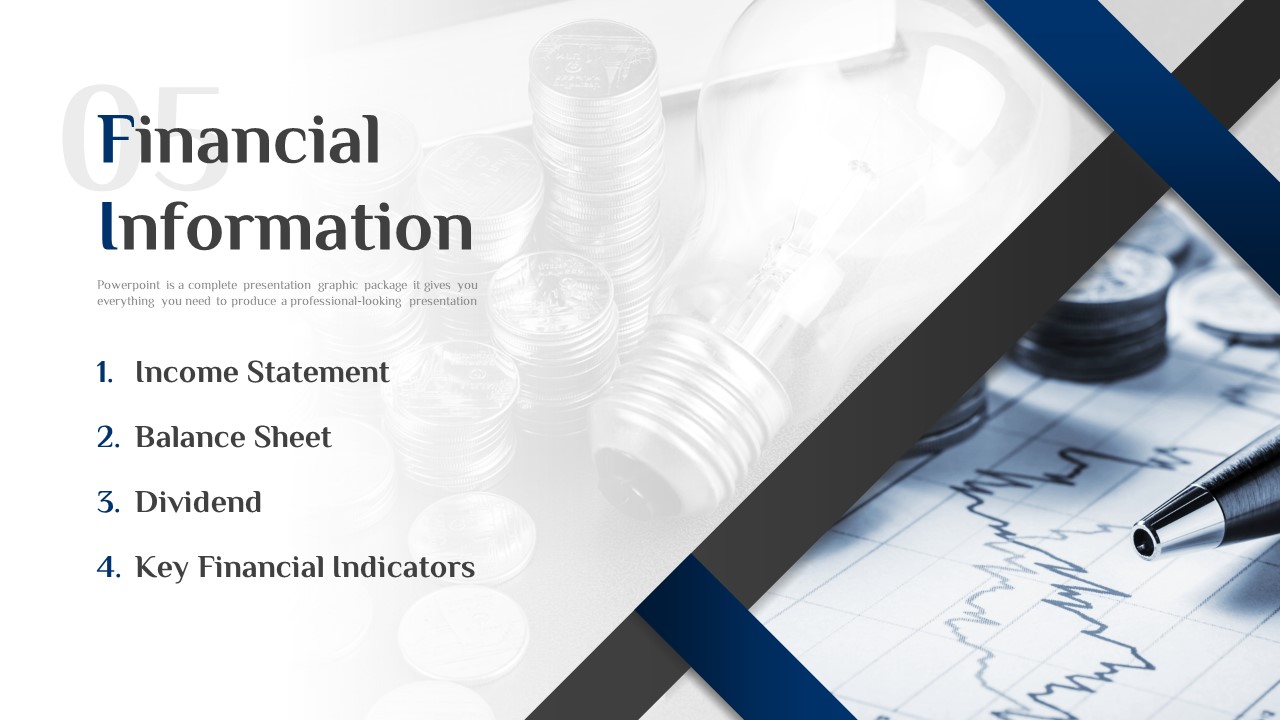
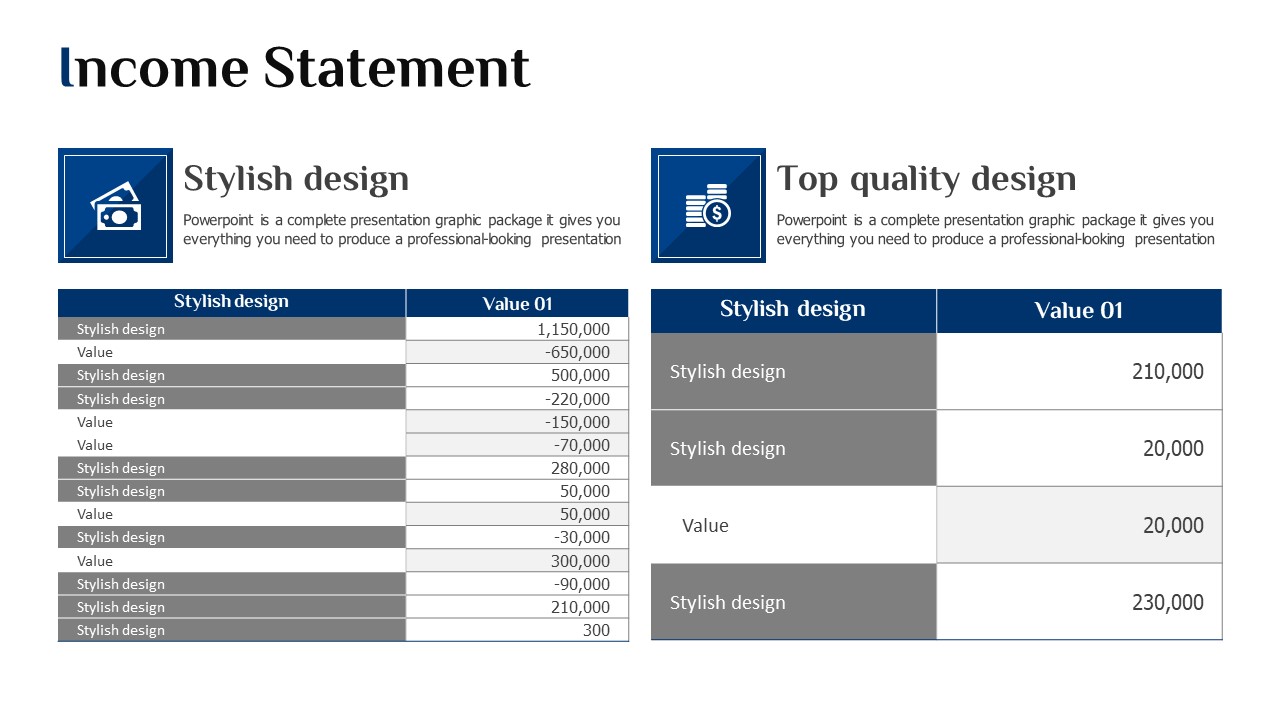
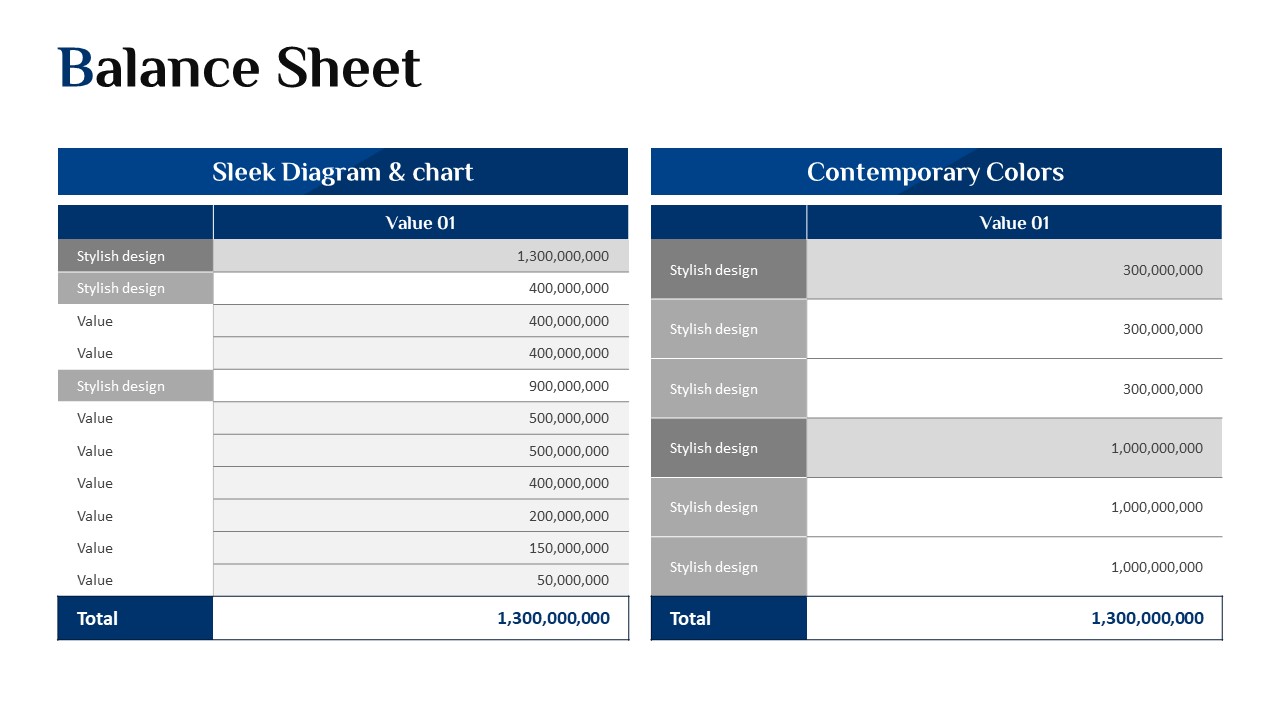
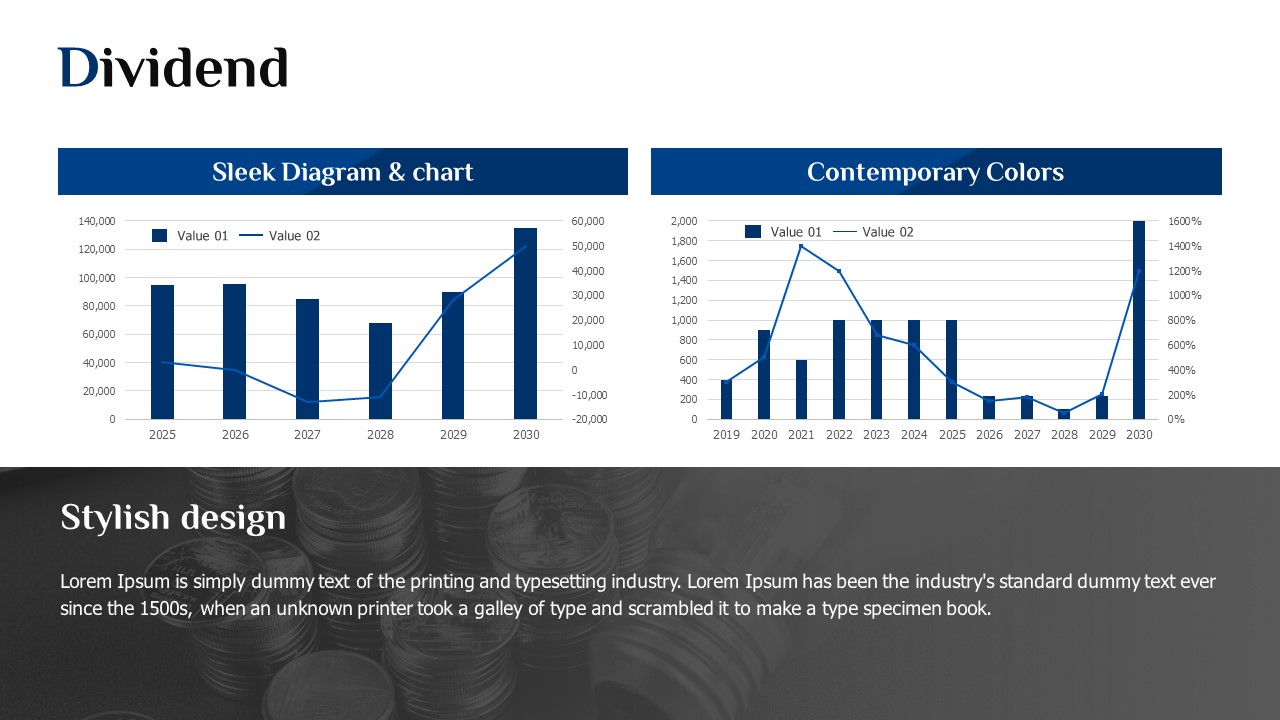
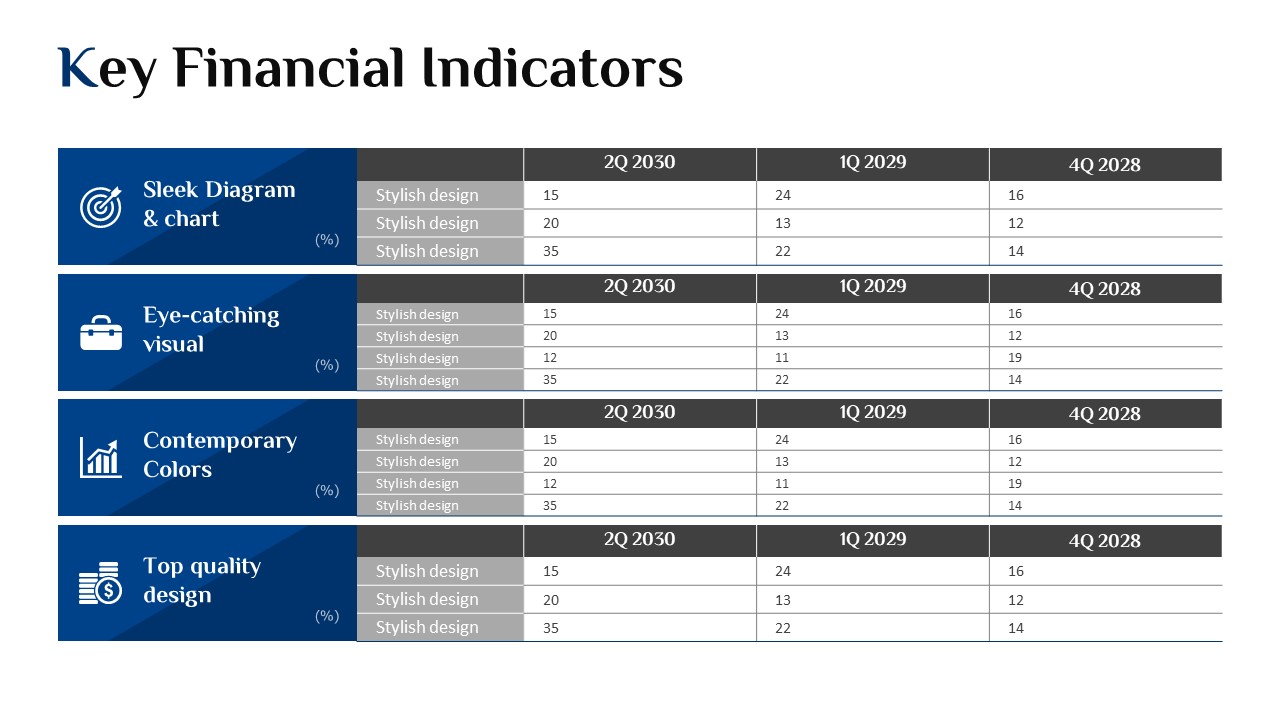
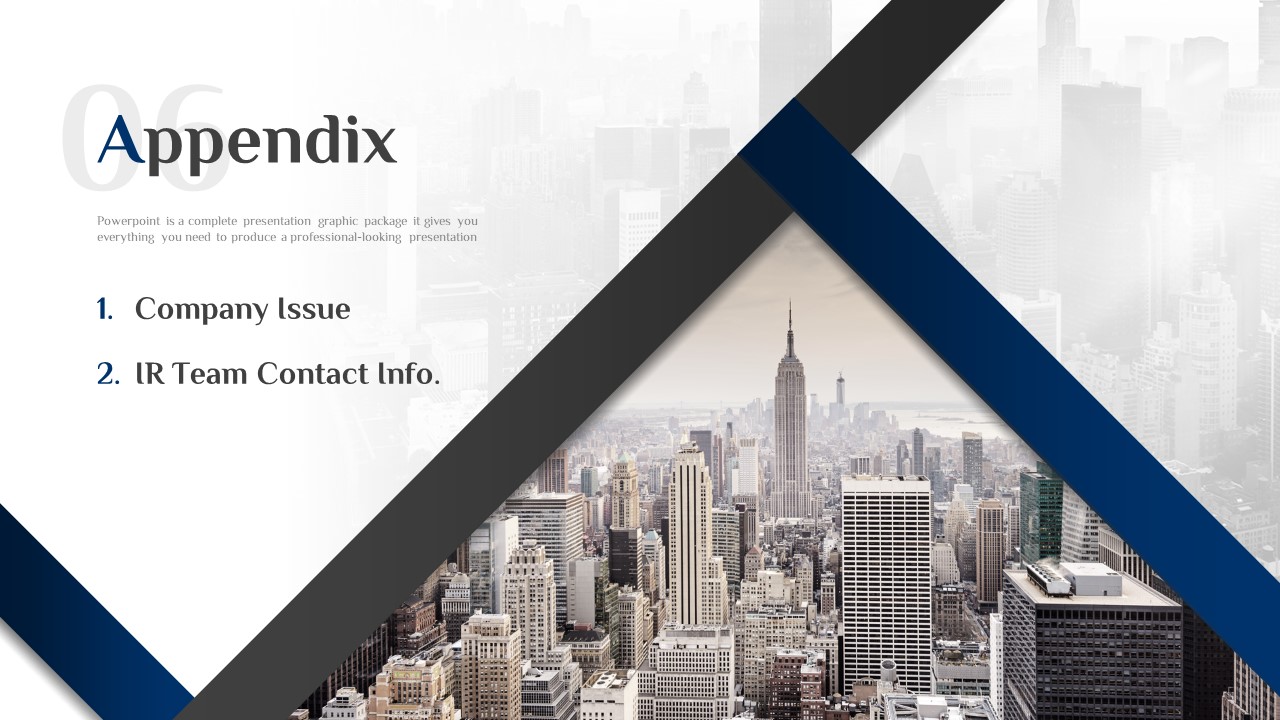
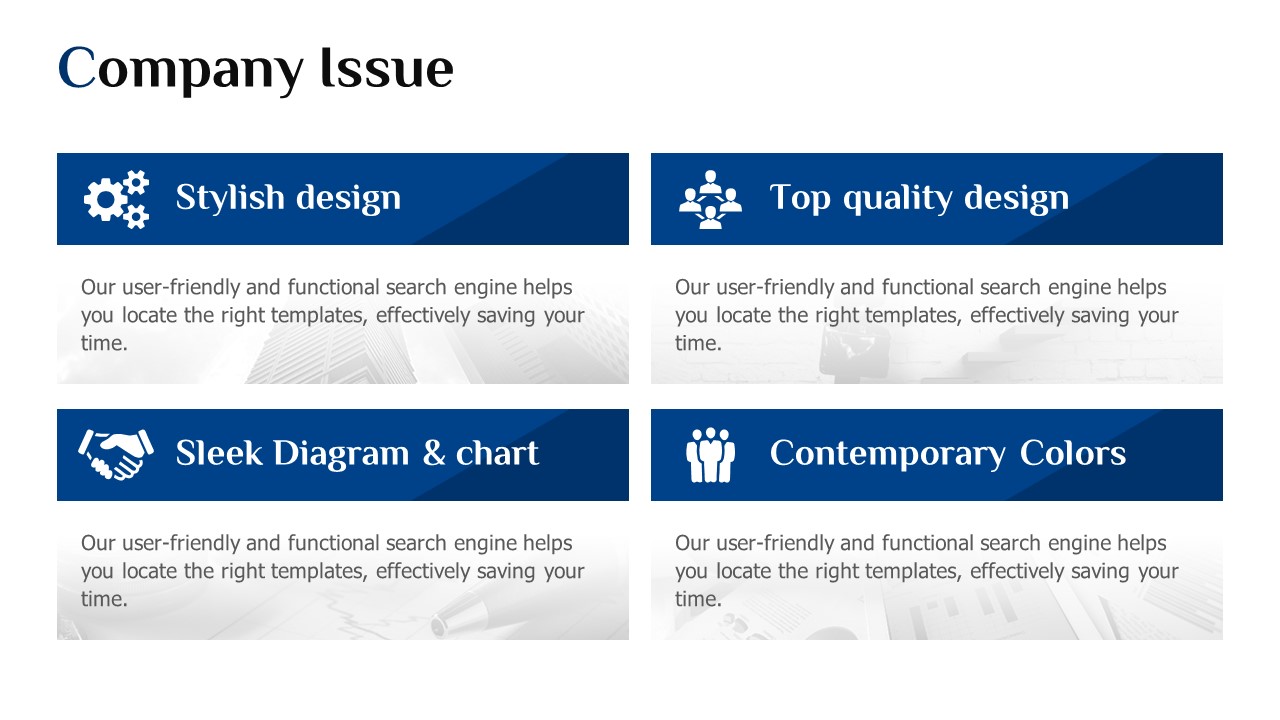
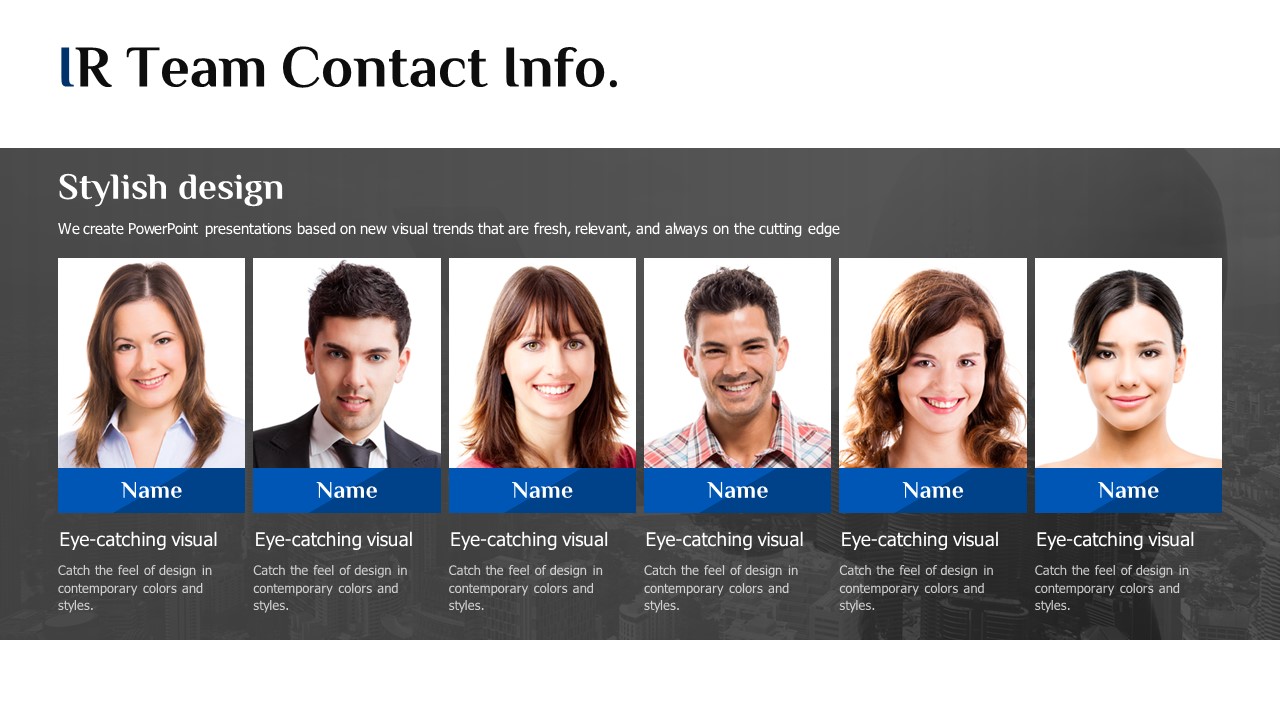
A professional investor relations PowerPoint template designed to persuade investors and review committees. Built on a navy blue and dark gray diagonal geometric layout, this pitch deck delivers a polished, finance-grade visual identity suited for corporate IR presentations. The 33-slide set covers a complete IR structure: business status, core values, shareholder composition, and financial information including income statement, balance sheet, dividend policy, and key financial indicators. Data visualization slides—timeline charts, four-quadrant cluster diagrams, donut charts, and two-column comparison tables—are included to strengthen number-driven arguments. Delivered as an editable PPTX file, all text, figures, and chart data can be freely updated. Replace the placeholder content with your own company information and the presentation is ready to submit.
Usage Points
-
Main Usage
Designed for investor relations presentations and fundraising pitches targeting investors, venture capitalists, and review committees. Provides a complete IR slide structure from business overview to financial data in a single ready-to-use deck.
-
How to Use
Open the PPTX file and replace placeholder text, figures, and chart data with your company's actual information. Use the section divider slides as structural anchors, and update the donut chart and comparison tables with real financial figures before your presentation.
-
Recommended For
Ideal for startup founders, corporate IR managers, CFOs preparing fundraising materials, and business development teams submitting documents to venture capital firms. Suitable for IR presentations across finance, technology, and manufacturing sectors.
-
Slide Structure
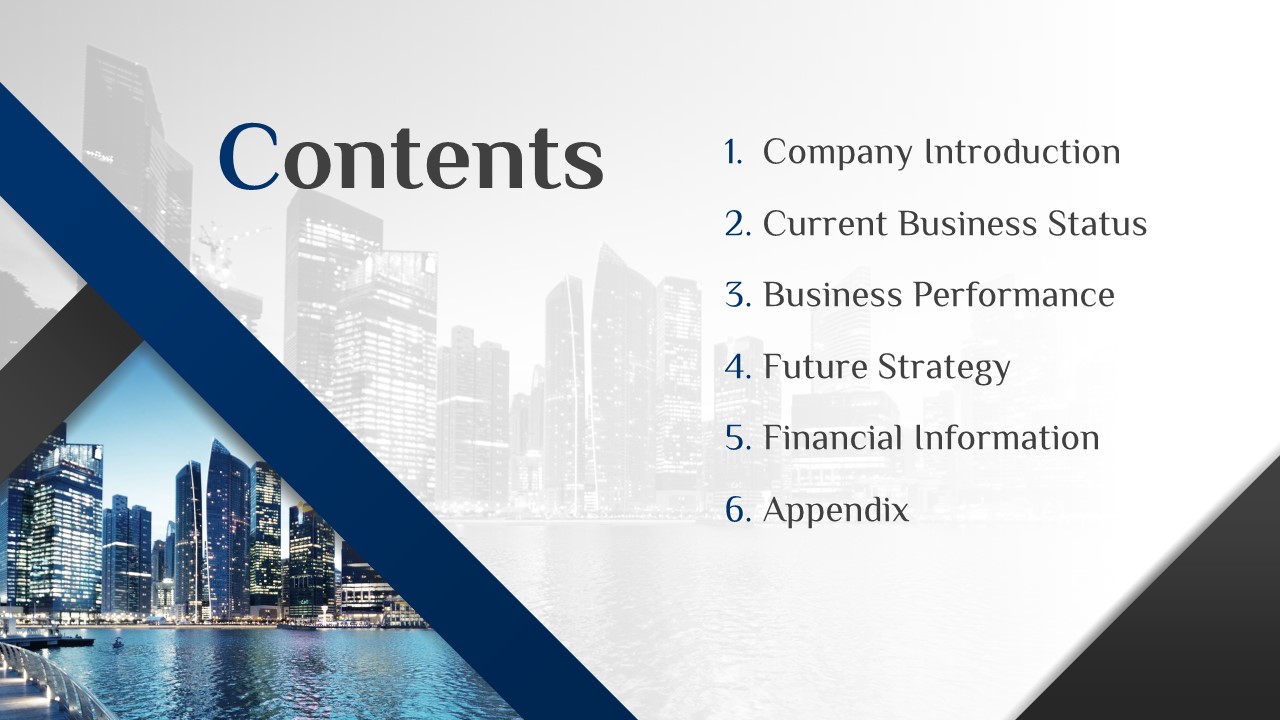
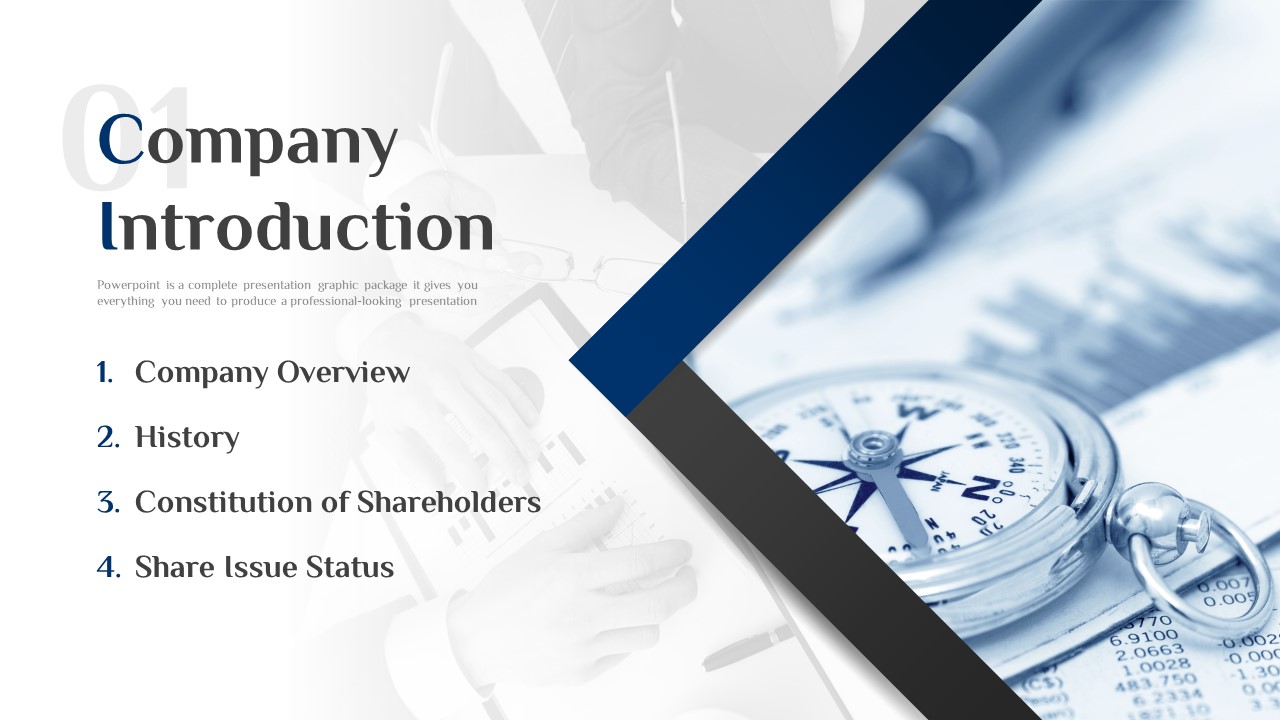
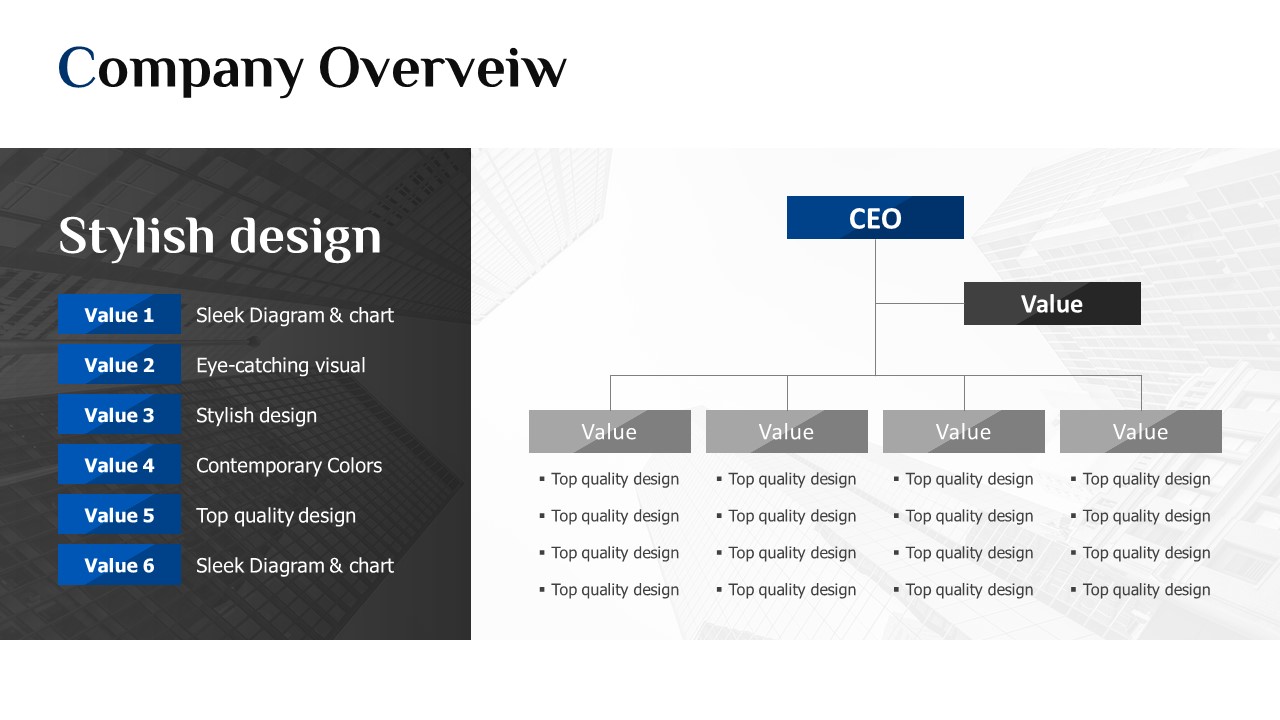
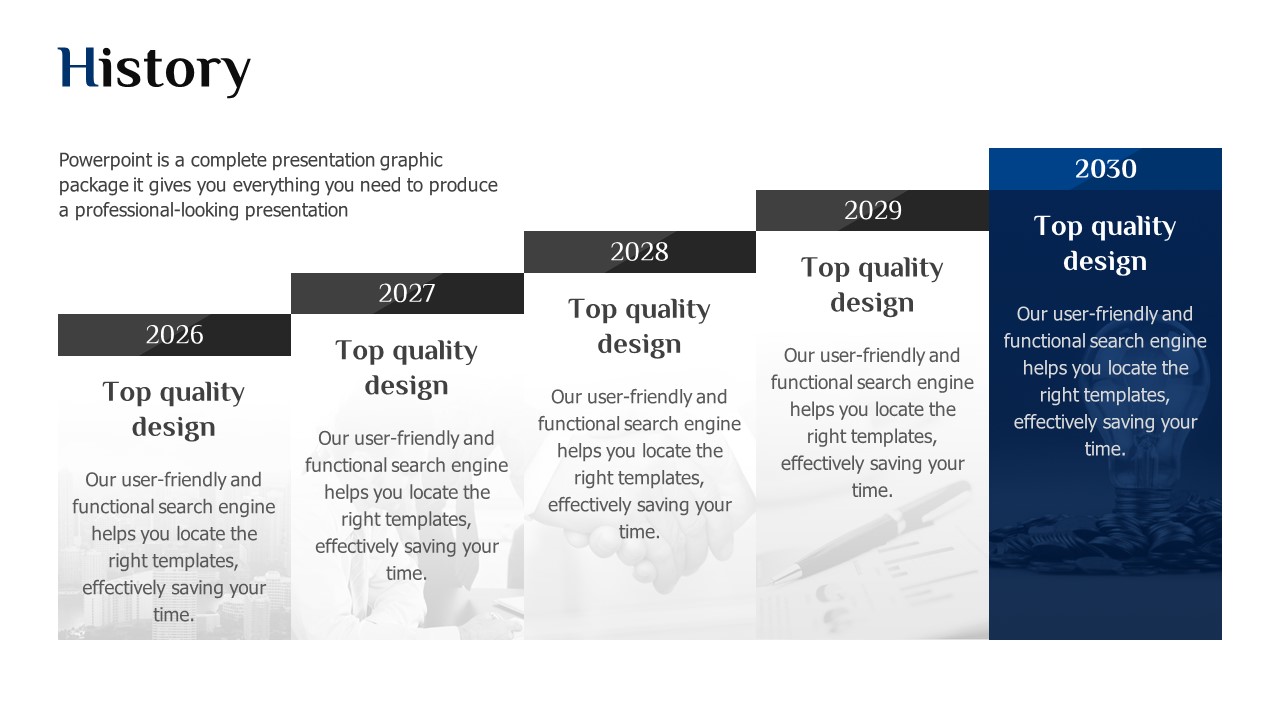
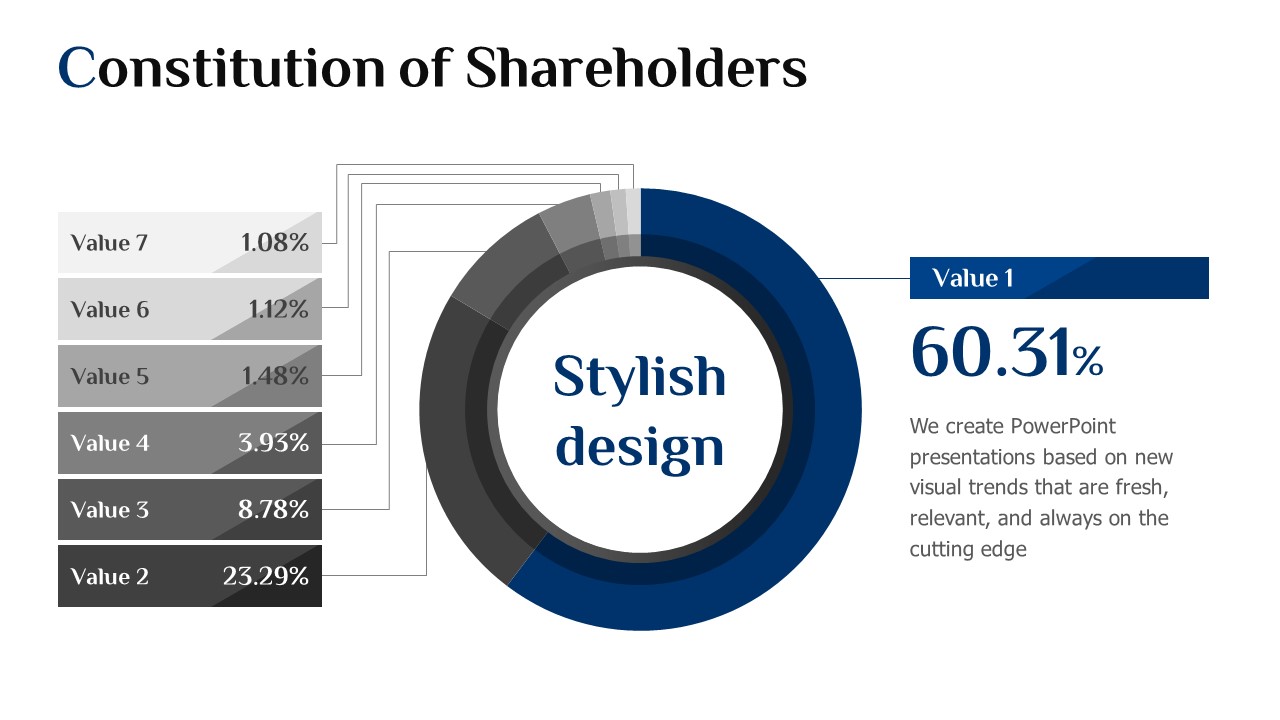
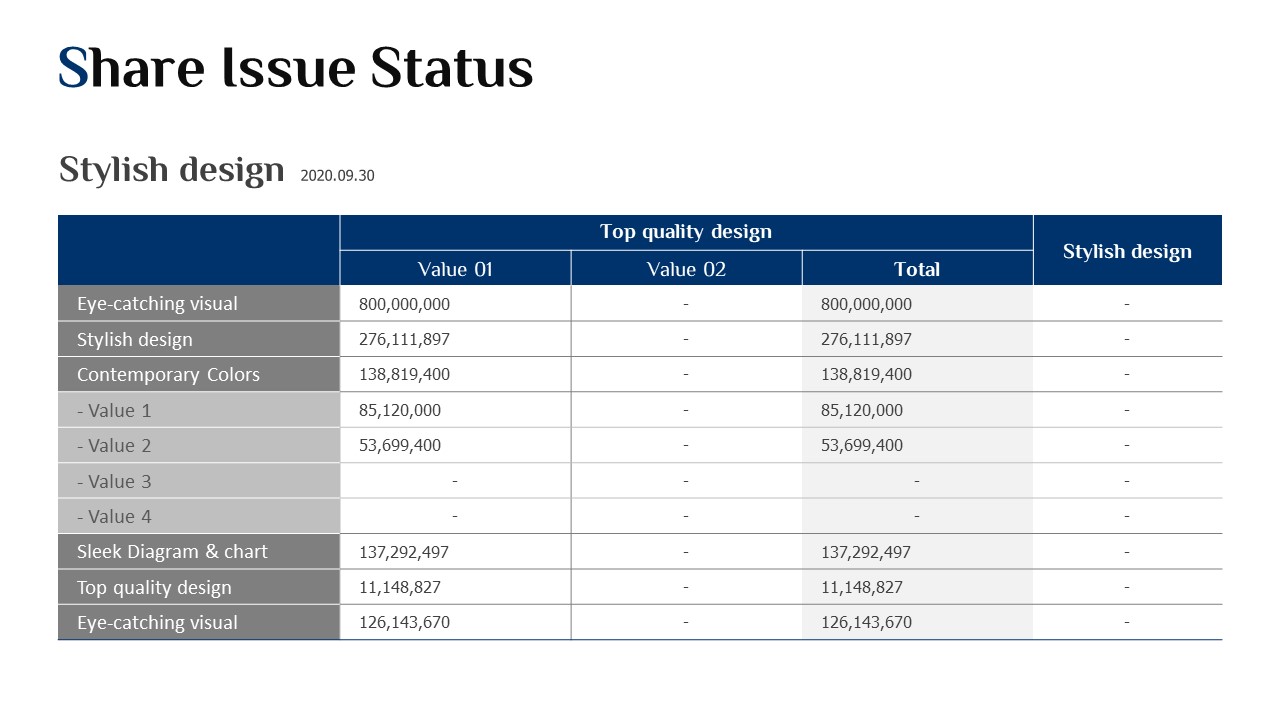
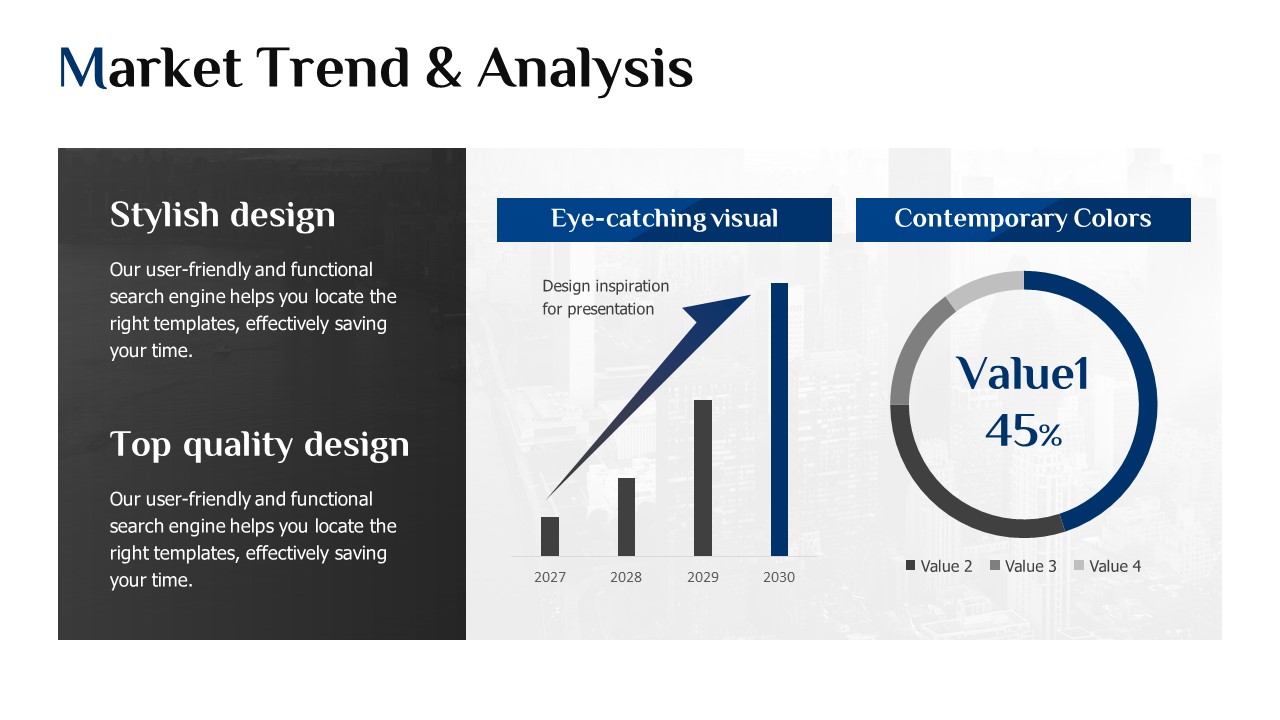
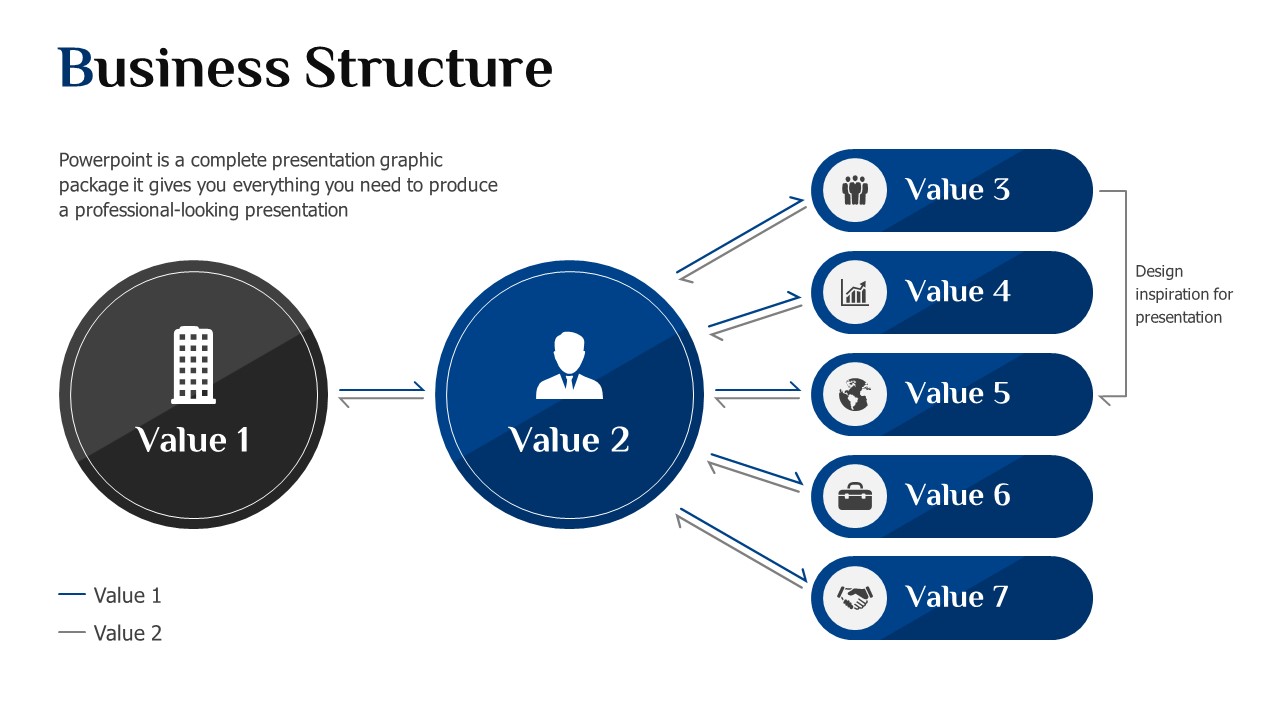
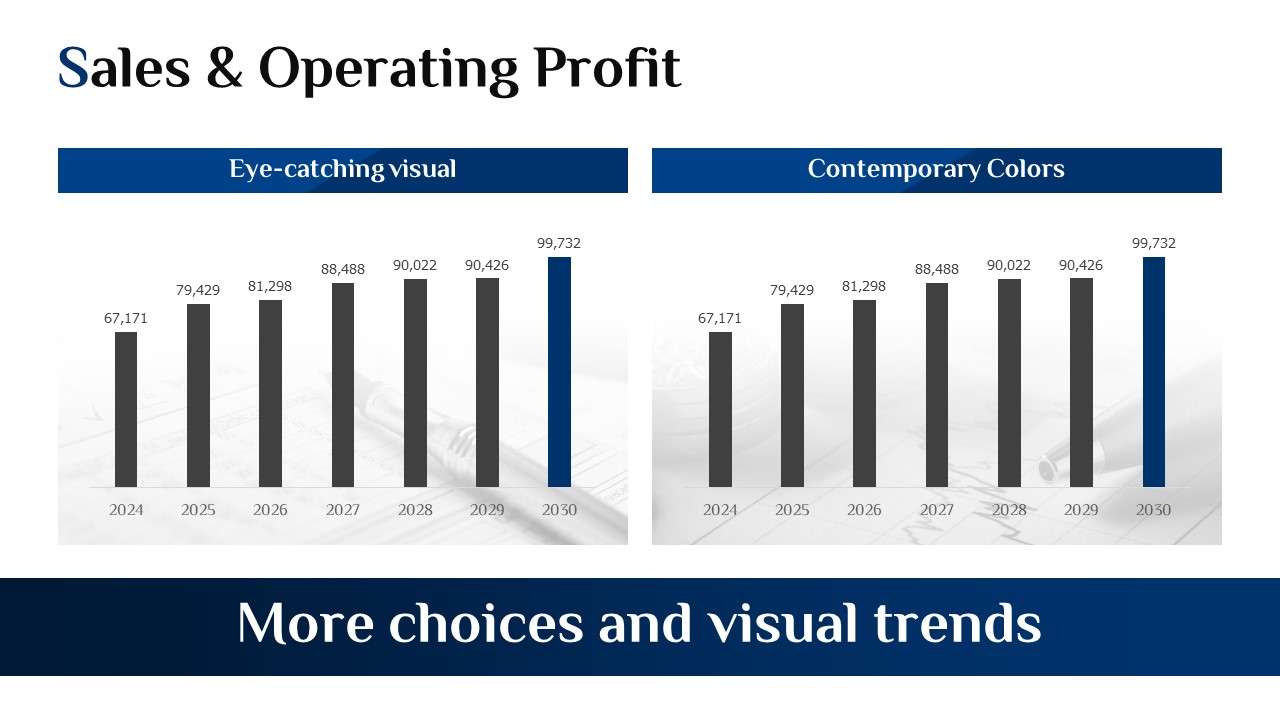
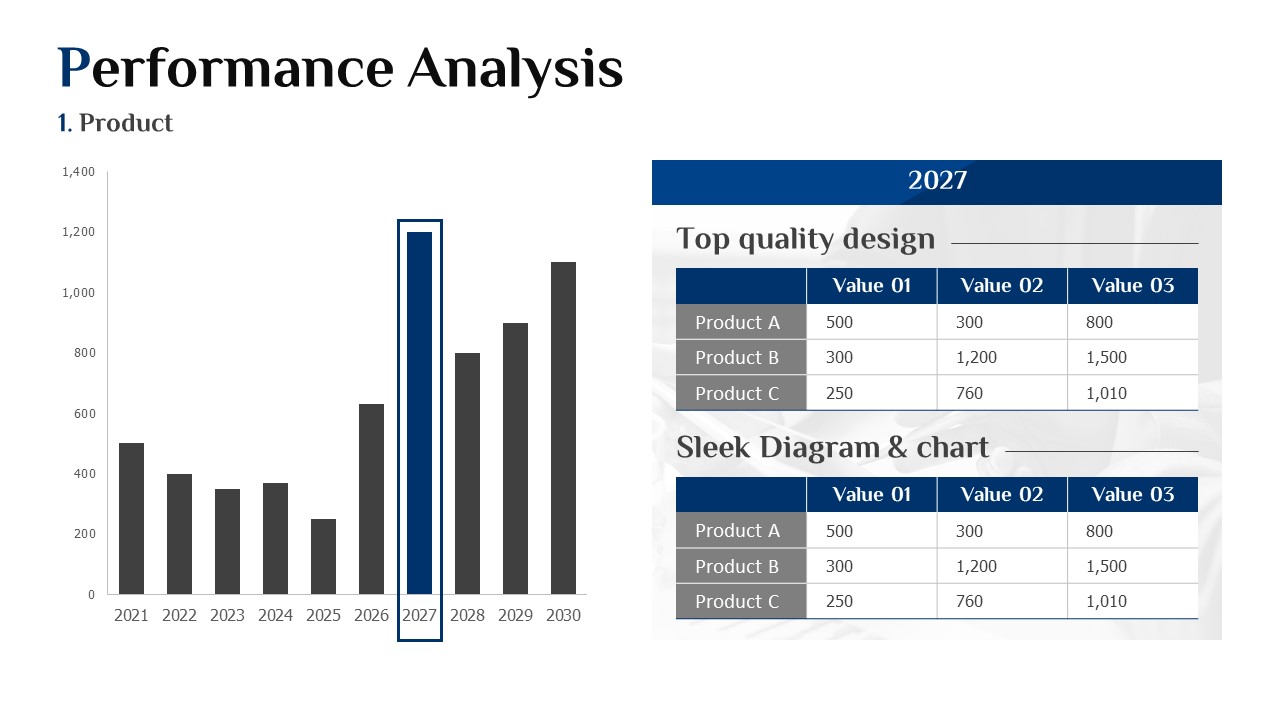
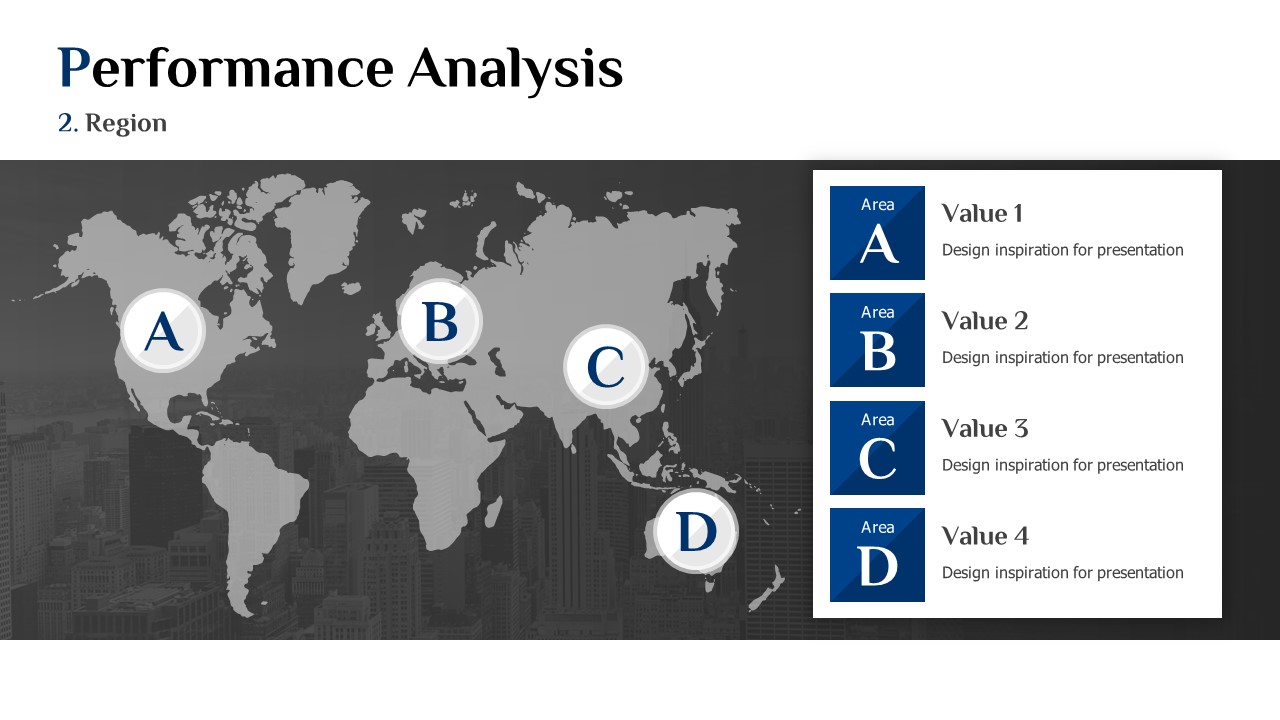
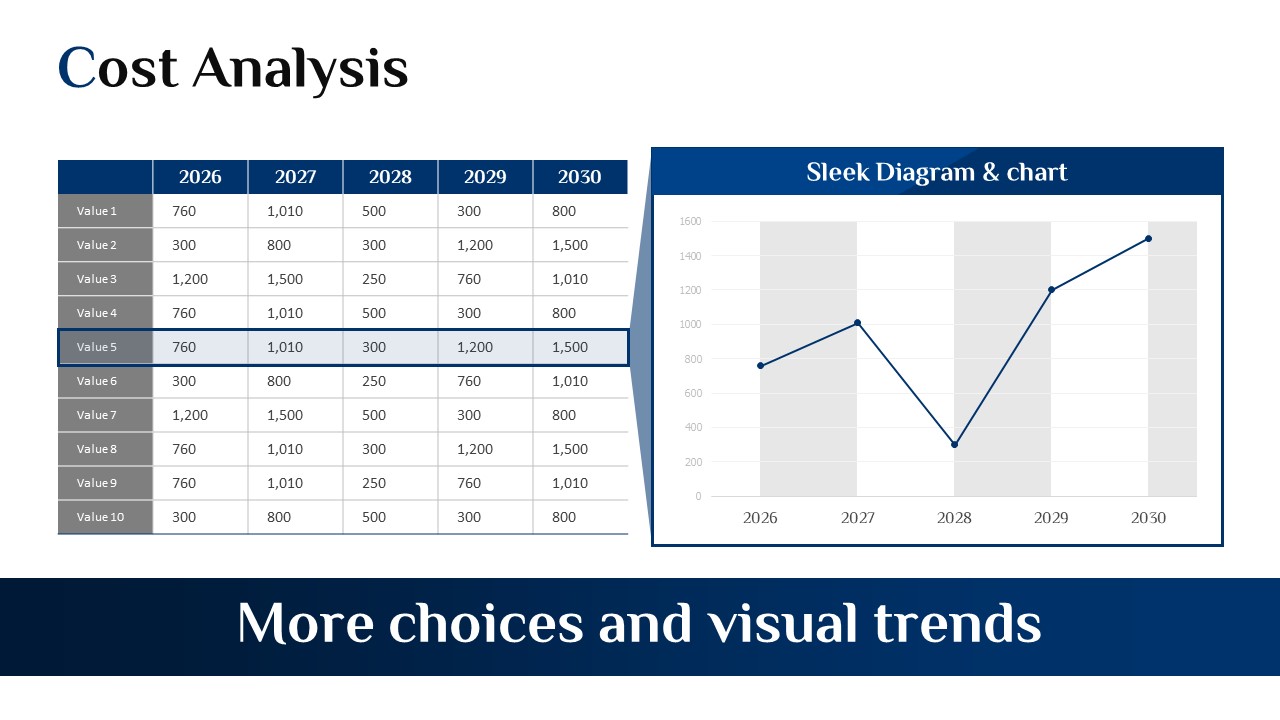
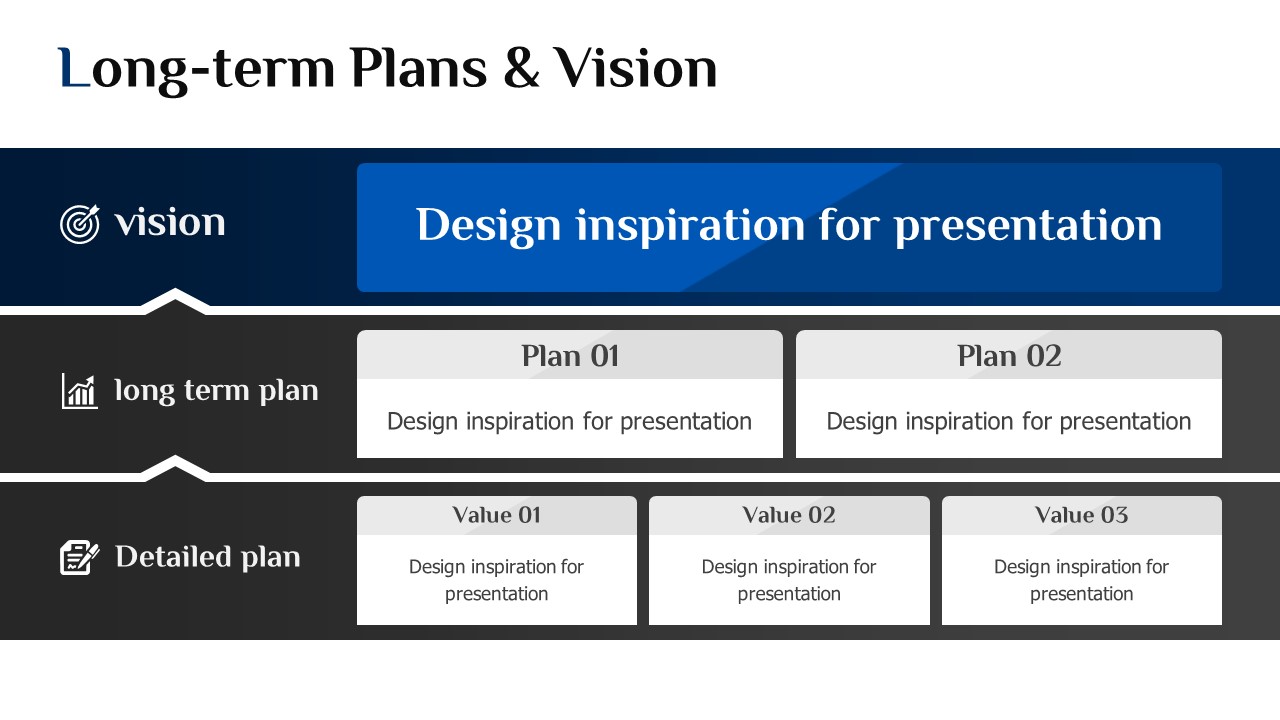
33 slides total: Cover → Section 02 Business Status (Market Trend & Analysis, Business Structure) → Core Value four-quadrant cluster diagram → History timeline (2026–2030) → Shareholder Constitution (donut chart with ownership table) → Section 05 Financial Information (Income Statement, Balance Sheet, Dividend, Key Financial Indicators).
Related Products
-

Investment Presentation Strategy Vertical Template – Modern Design and Practicality
#Investor Relations/IR
-

Investment in Real Estate Strategy Vertical Template - Professional Business Design
#Investor Relations/IR
-

Pitch Deck Template | The 4-Step AI Startup IR Deck That Gets Investors to Say Yes in 5 Seconds
#Investor Relations/IR
-

Direction IR Template – Stylish Design and Effective Presentation Flow
#Investor Relations/IR
