Product Top Sales Analysis Graph – Market and Competitor Analysis
RM0600006_13
- Last Update 02/24/2025
- File Size 1MB
- # of Slides 2
- File Format PPTX
- Slide Ratio 16:9
- Color
Keywords
- #Content-Based Slides
- #Design-Based Slides
- #Business Strategy
- #Market and Competitor Analysis
- #Diagram
- #Graph
- #Production Plan
- #Market Analysis
- #Table
- #Horizontal Bar
- #Horizontal Bar Chart
- #16:9
- #bar chart PowerPoint slide
- #product sales analysis template
- #revenue comparison chart
- #market analysis slide deck
- #sales performance PowerPoint template download
About the Product
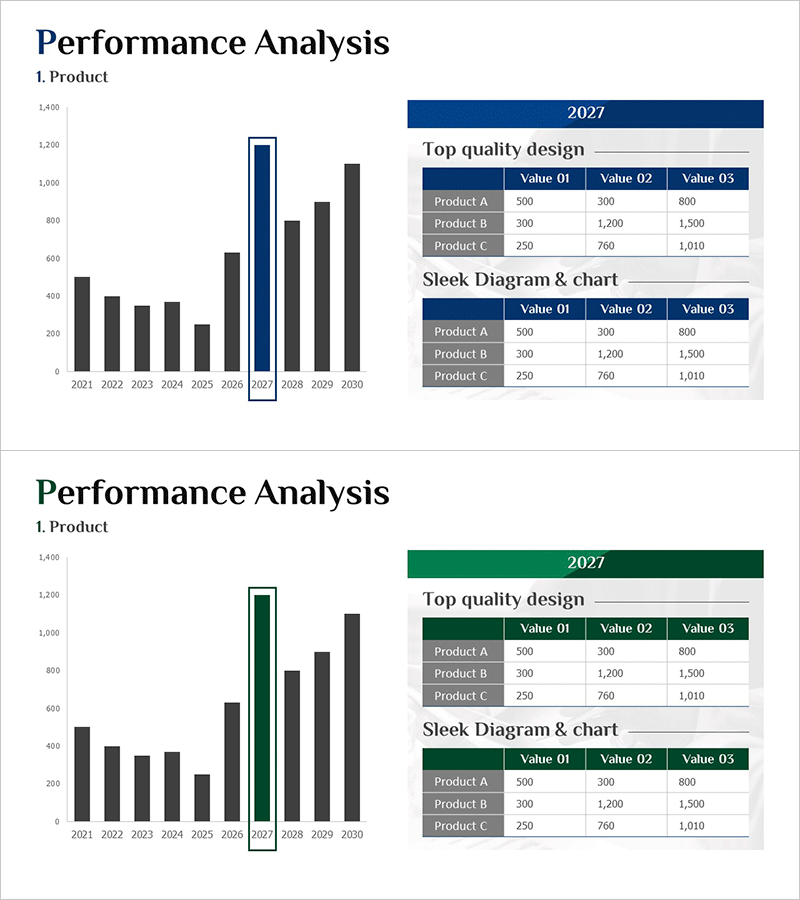
A 2-slide PowerPoint presentation template featuring bar charts to visualize top product sales performance and year-over-year revenue trends. The design uses contrasting navy blue and forest green color schemes to clearly differentiate product performance and sales progression. Each slide includes a highlighted data table on the right side displaying key metrics for Products A, B, and C across three value categories. This presentation slide deck is ready to use for market analysis reports, competitive benchmarking, business performance reviews, and quarterly sales presentations.
Usage Points
-
Main Usage
This slide template displays product sales performance and annual revenue trends using vertical bar charts with contrasting navy blue and forest green colors. The accompanying data table on the right provides specific numerical values, enabling clear comparison of sales metrics across multiple products and time periods.
-
How to Use
Use this template in business performance reports, quarterly earnings presentations, and competitive analysis meetings. Replace the sample data in the bar chart and data table with your actual sales figures. The layout supports both historical trend analysis and product-to-product comparisons.
-
Recommended For
Sales directors, marketing managers, and business analysts presenting quarterly or annual performance reports. Ideal for investor presentations, executive briefings, and strategic planning sessions where quantitative sales data and market positioning need to be communicated clearly.
-
Slide Structure
Two-slide set, each featuring a vertical bar chart spanning approximately 10 years of data with one year highlighted, paired with a 3-product × 3-metric data table. Available in two color variations (navy and green). Optimized for 16:9 widescreen format with editable chart and table elements.
Related Products
-

Top Sales Analysis Graph – Visualizing Market and Performance
#Market and Competitor Analysis #Financial Plans and Performance #Diagram
-

Competitor and Customer Analysis Horizontal Bar Graph and Table
#Market and Competitor Analysis #Diagram #Graph
-

Performance Analysis 3D Bar Chart & Table – Market and Performance Analysis
#Company Introduction #Market and Competitor Analysis #Diagram
-

Stylish Bar Chart Slide Design
#Market and Competitor Analysis #Diagram #Graph
