Chart of Changes in the Ratio of Institutional and Individual Investors – Simplified Shareholder Composition
RM0600006_6
- Last Update 02/25/2025
- File Size 1MB
- # of Slides 2
- File Format PPTX
- Slide Ratio 16:9
- Color
Keywords
- #Content-Based Slides
- #Design-Based Slides
- #Company Introduction
- #Market and Competitor Analysis
- #Graph
- #Shareholder Structure
- #Market Status
- #Circles
- #Doughnut Chart
- #16:9
- #donut chart PowerPoint
- #pie chart slide template
- #shareholder composition visualization
- #investor ratio chart
- #how to create donut chart in PowerPoint
About the Product
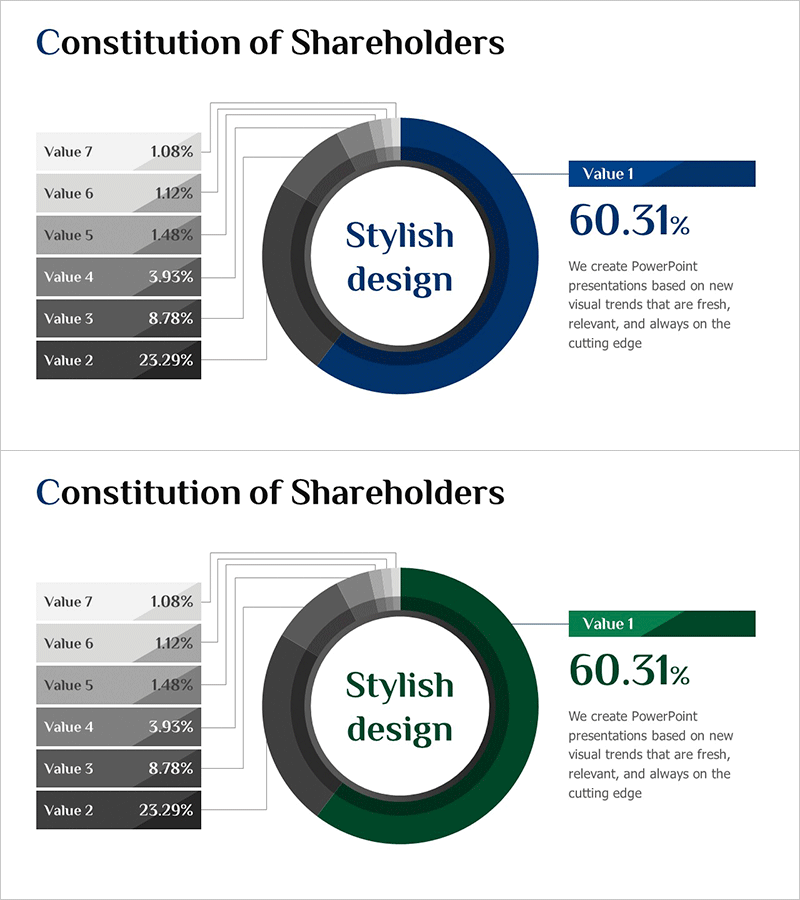
A professional donut chart PowerPoint slide set with 2 slides for visualizing shareholder composition ratios. The design features a central circular area for key messaging and an outer ring divided into 7 segments representing different investor categories including institutional and individual investors. The dark blue and gray color palette is ideal for corporate presentations and financial reports. Both slides maintain consistent layout for easy time-series comparison of investor ratio changes. Delivered in 16:9 widescreen PPTX format compatible with all presentation environments.
Usage Points
-
Main Usage
Clearly communicate shareholder composition and investor ratio changes using a donut chart design. The central circular area highlights key messages while the outer ring's 7 segments accurately represent each category's proportion. Effectively compare institutional investors, individual investors, and foreign investor distributions in corporate capital structure analysis.
-
How to Use
Apply to investor relations (IR) presentations, shareholder meetings, and corporate earnings reports in the shareholder composition section. The 2-slide format enables sequential visualization of ratio changes over time. Customize segment colors and numerical values to match your actual data and corporate branding requirements.
-
Recommended For
Recommended for corporate finance teams, investor relations managers, securities analysts, and executives preparing shareholder meeting presentations. Ideal for quarterly and annual earnings announcements, capital structure explanations, and IPO-related presentations requiring credible data visualization.
-
Slide Structure
2-slide set with consistent layout throughout. Central donut ring displays 'Shareholder Composition' text with 7 outer segments representing different investor categories. Left side shows legend with Values 2-7 and percentages. Right side highlights Value 1 (60.31%) with supporting descriptive text. Color scheme uses dark blue, gray, and white to reinforce corporate identity and professional appearance.
Related Products
-

Key Shareholder Analysis One Donut Chart
#Company Introduction #Market and Competitor Analysis #Graph
-

Investor Ratio Comparison Analysis Chart – Market Status and Competitive Analysis
#Company Introduction #Market and Competitor Analysis #Diagram
-

Graph of Analysis of Major Shareholder Stake - Effective Comparison
#Company Introduction #Market and Competitor Analysis #Graph
-

Doughnut Chart for Shareholder Composition Analysis – Emphasizing Trust and Transparency
#Company Introduction #Market and Competitor Analysis #Graph
