Income Statement Analysis Table – View Financial Performance at a Glance
RM0600006_25
- Last Update 02/24/2025
- File Size 1MB
- # of Slides 2
- File Format PPTX
- Slide Ratio 16:9
- Color
Keywords
- #Content-Based Slides
- #Design-Based Slides
- #Financial Plans and Performance
- #Diagram
- #Income Statement
- #Cash Flow Statement
- #Table
- #16:9
- #income statement PPT slide
- #financial table PowerPoint
- #income statement analysis slide
- #financial data table presentation
- #how to present financial performance in PowerPoint
About the Product
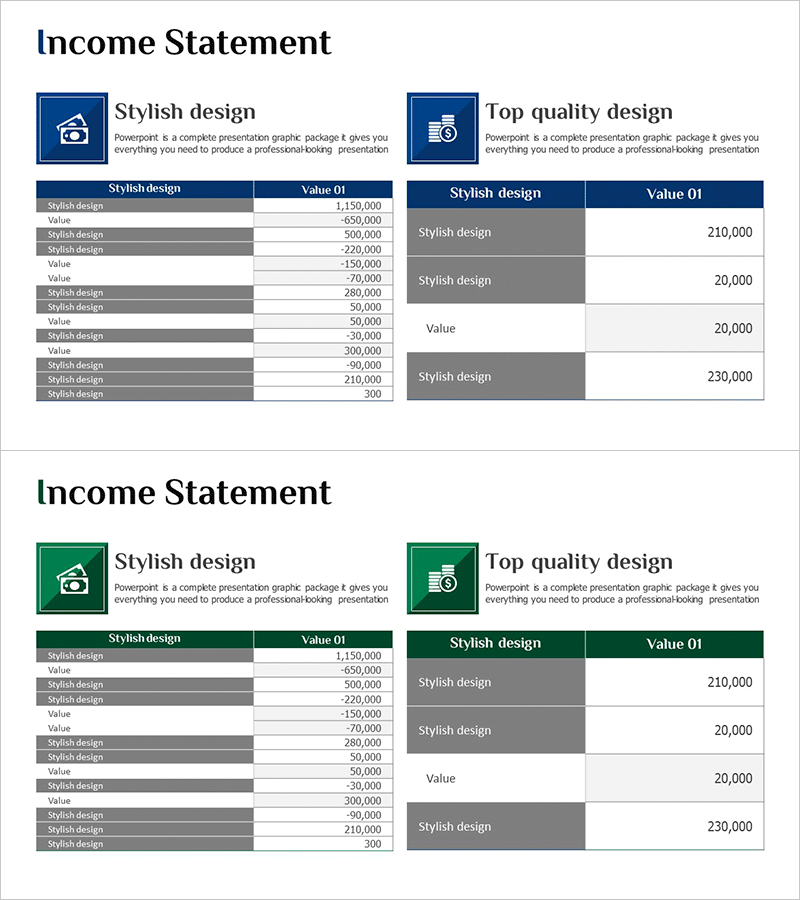
A professional income statement analysis PowerPoint slide designed to present financial performance with clarity and impact. The layout features a detailed line-item table on the left and a summary metrics comparison section on the right, separated by a dark blue header and gray row dividers for optimal data readability. Two slide versions—Stylish Design and Top Quality Design—are included, allowing you to match your corporate branding and presentation context. Ideal for investor presentations, financial reports, earnings calls, and executive briefings requiring precise financial data visualization.
Usage Points
-
Main Usage
Communicate financial performance metrics through structured numerical data and tabular formats. The dual-layout approach—detailed line items on the left and summary figures on the right—enables audiences to grasp both granular and high-level financial insights simultaneously. Specialized for financial clarity and data-driven decision support.
-
How to Use
Deploy in investor relations (IR) presentations, quarterly earnings calls, annual financial reports, and executive briefings. Populate the left table with actual financial line items and highlight key performance indicators in the right summary area. Customize the dark blue header to match your corporate color palette.
-
Recommended For
CFOs, financial controllers, and executives presenting to investors, shareholders, and board members. Particularly effective for quarterly earnings announcements, annual financial reviews, capital raising presentations, and financial institution communications. Suitable for accounting firms and financial advisory presentations.
-
Slide Structure
Two-slide set. Each slide divides the canvas into a detailed line-item table (8–12 rows × 2 columns) on the left and a summary metrics section (4–5 key figures) on the right. Headers feature dark blue backgrounds with white typography; data rows use gray backgrounds to establish visual hierarchy. Both versions are formatted in 16:9 widescreen ratio for compatibility with modern projectors and displays.
Related Products
-

Year-over-Year Comparison Income Statement – Financial Performance Analysis
#Financial Plans and Performance #Diagram #Income Statement
-

Balloon Pile Table Chart – Communicating Financial Performance
#Financial Plans and Performance #Diagram #Income Statement
-

Income Statement Table – Visualizing Financial Performance
#Financial Plans and Performance #Diagram #Income Statement
-

Income Statement Table by Year
#Financial Plans and Performance #Diagram #Income Statement
