Sales Outlook Table & Bar Chart – Market and Financial Insights
RM0600006_22
- Last Update 02/24/2025
- File Size 0.9MB
- # of Slides 2
- File Format PPTX
- Slide Ratio 16:9
- Color
Keywords
- #Content-Based Slides
- #Design-Based Slides
- #Market and Competitor Analysis
- #Financial Plans and Performance
- #Diagram
- #Graph
- #Future Outlook
- #Sales and Revenue
- #Table
- #Horizontal Bar
- #Horizontal Bar Chart
- #16:9
- #sales projections PowerPoint slide
- #table bar chart template
- #financial analysis presentation
- #business data visualization
- #revenue forecast slide download
About the Product
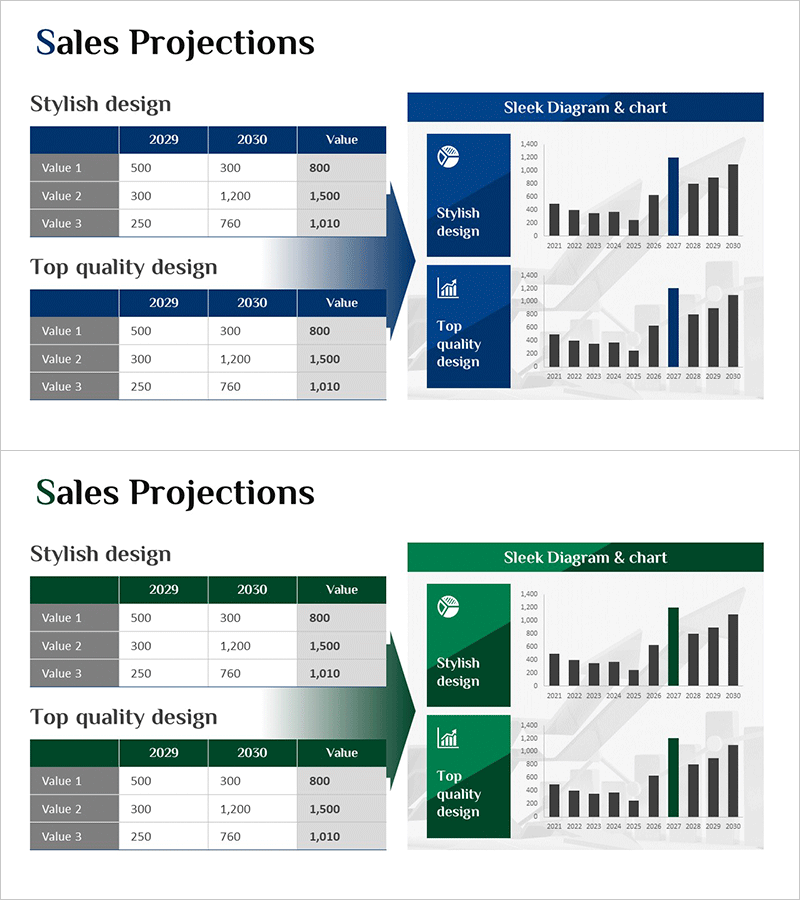
A 2-slide PowerPoint presentation featuring sales projection data visualized through both table and bar chart formats. The design uses a navy blue background with white typography for high-contrast readability in financial reports and market analysis presentations. The left side displays a structured table showing three fiscal years (2029, 2030, and Value) across three data categories (Value 1, 2, and 3), while the right side presents the same data as a vertical bar chart for comparative analysis. Arrow connectors link the table to the chart, clarifying the data relationship. Each slide includes icon and title areas to emphasize presentation context. Delivered in 16:9 widescreen PPTX format compatible with all presentation environments.
Usage Points
-
Main Usage
Simultaneously express financial performance, market outlook, and sales forecast data through table and chart formats, combining numerical credibility with visual clarity. Ideal for executive reports, investor presentations, and quarterly earnings announcements to communicate historical, current, and projected trends.
-
How to Use
Input actual revenue, cost, and profit figures into table cells; the chart automatically updates to reflect changes. Organize year-by-year and category-by-category data in the left table, then emphasize comparative analysis results in the right chart. The navy background maintains excellent readability on projectors and large screens, with clear contrast preserved in printed materials.
-
Recommended For
CFOs, finance managers, and business analysis teams preparing quarterly and annual performance reports. Also valuable for marketing teams analyzing market size and customer acquisition trends, sales teams comparing targets versus actuals, and executive strategy meetings requiring data-driven insights.
-
Slide Structure
Slide 1: Navy background + left table (3 rows × 4 columns with years, categories, and values) + right vertical bar chart (5 series, 10 data points) + center arrow connector. Slide 2: Identical structure with top icon and title area to specify chart type and analysis subject.
Related Products
-

Sales Outlook Comparison Analysis Chart – Market Analysis and Performance
#Market and Competitor Analysis #Financial Plans and Performance #Diagram
-

Sales Outlook Analysis Chart – Sleek Data Visualization
#Market and Competitor Analysis #Financial Plans and Performance #Diagram
-

Performance Advantage Analysis Chart – Evolving Business Success
#Company Introduction #Market and Competitor Analysis #Diagram
-

Successful Business Future Outlook Analysis Graph
#Market and Competitor Analysis #Diagram #Graph
