Analysis Table by Main Task – Financial Planning and Performance
RM0600006_28
- Last Update 02/24/2025
- File Size 1MB
- # of Slides 2
- File Format PPTX
- Slide Ratio 16:9
- Color
Keywords
- #Content-Based Slides
- #Design-Based Slides
- #Business Management
- #Financial Plans and Performance
- #Diagram
- #Project Staffing
- #Key Financial Indicators
- #Table
- #16:9
- #financial indicators PowerPoint slide
- #financial analysis table template
- #key metrics comparison slide
- #quarterly performance data PPT
- #investor presentation financial slide
About the Product
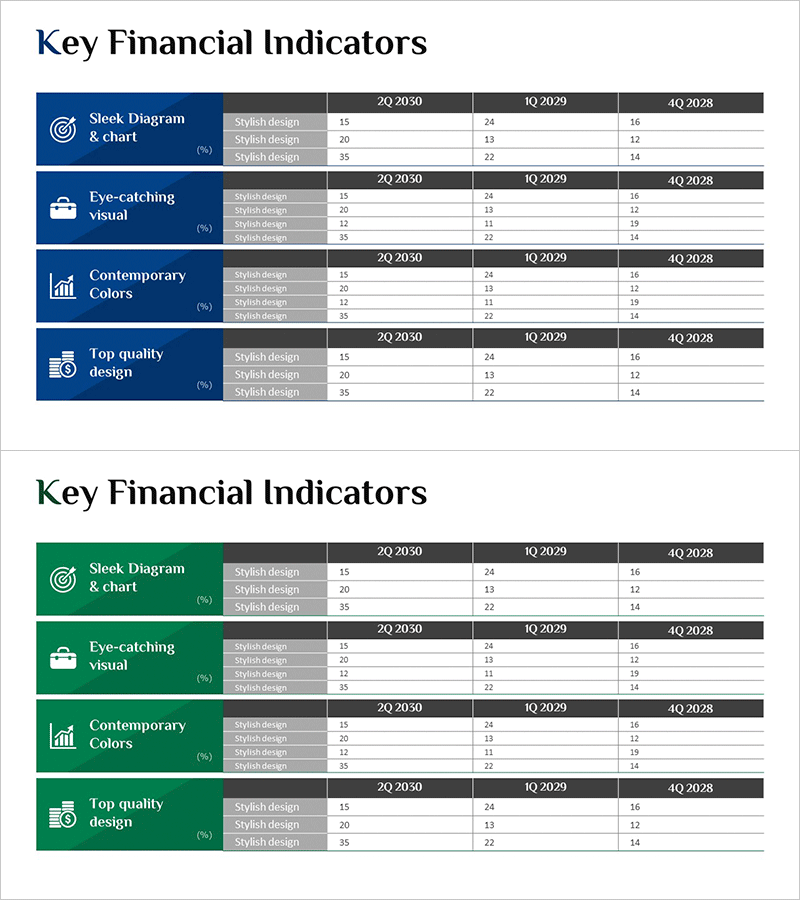
A PowerPoint slide designed to visually compare and analyze financial performance metrics. The layout features a dark background with icon areas on the left and data tables on the right, enabling clear display of quarterly and annual figures. This slide type compares four design approaches (Sleek Diagram & chart, Eye-catching visual, Contemporary Colors, Top quality design) simultaneously, making it immediately applicable for investor presentations and executive reports. The 2-slide set provides flexible expression of various financial indicators, optimized for modern presentation environments in 16:9 widescreen format.
Usage Points
-
Main Usage
Used in investor relations, executive reporting, and financial performance presentations to clearly compare and visualize quarterly and annual key metrics. The dark background design enhances credibility and trust in finance and accounting sections.
-
How to Use
Enter financial metric names (revenue, profit, cash flow, etc.) in the left icon area and input quarterly or annual figures in the right data table. Display all 4 items simultaneously or use selectively as needed. Colors and numerical values are fully editable.
-
Recommended For
Recommended for CFOs, finance managers, and IR teams presenting financial performance at board meetings, shareholder meetings, and investor briefings. Also effective for emphasizing key metrics in the financial section of business plans and fundraising materials.
-
Slide Structure
2-slide set with each slide divided into a left dark blue icon area (displaying 4 items) and a right data table area. The table uses row-column structure for quarterly and annual data entry, allowing independent data visualization for each metric.
Related Products
-

Financial Indicators and Income Statements – Current Trends and Statistics
#Financial Plans and Performance #Diagram #Income Statement
-

Analyze Financial Performance with Yearly Income Statement
#Financial Plans and Performance #Diagram #Income Statement
-

Visualizing Financial Plans with an Income Statement Table Slide
#Financial Plans and Performance #Diagram #Income Statement
-

Visualizing Key Financial Indicators with Diagram Presentation
#Financial Plans and Performance #Diagram #Sales and Revenue
