Production Cost Variance Analysis Chart – Visualizing Financial Performance
RM0600006_15
- Last Update 02/24/2025
- File Size 0.9MB
- # of Slides 2
- File Format PPTX
- Slide Ratio 16:9
- Color
Keywords
- #Content-Based Slides
- #Design-Based Slides
- #Financial Plans and Performance
- #Diagram
- #Graph
- #Budget
- #Sales and Revenue
- #Table
- #Line
- #Line Chart
- #16:9
- #line chart PowerPoint slide
- #cost analysis presentation template
- #trend visualization slide
- #financial data PowerPoint
- #how to create line chart in PowerPoint
About the Product
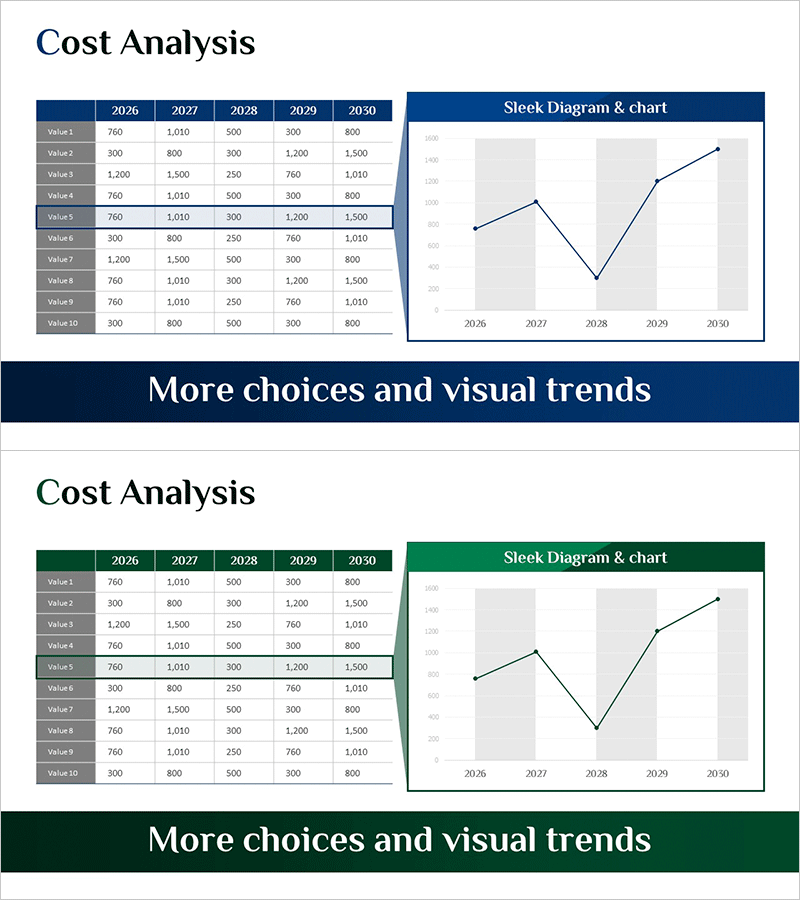
A line chart PowerPoint slide that tracks production cost variance across a 5-year period from 2026 to 2030. The design features a dark blue header with white background for optimal data readability, displaying two data series for multi-indicator comparison. Ten cost items are visualized by year, enabling quick assessment of financial performance trends. The layout combines a data table on the left with a corresponding line graph on the right, providing both numerical precision and visual clarity. This presentation slide is ready to use for budget planning, financial reports, and performance analysis presentations.
Usage Points
-
Main Usage
Visualize multi-year cost trends for production, operations, or sales expenses using line graphs, enabling quantitative financial performance analysis. The combined table and chart layout ensures both numerical accuracy and visual comprehension for stakeholder presentations.
-
How to Use
Enter actual cost data in the left table, and the right line graph automatically updates to reflect trend lines. The 2026–2030 five-year period can be adjusted to monthly or quarterly intervals for short-term performance analysis or extended for long-term strategic planning.
-
Recommended For
CFOs, finance managers, and executives presenting quarterly or annual financial results. Ideal for business plans, investor pitch decks, executive briefings, and budget review meetings where cost trends and financial health must be communicated persuasively.
-
Slide Structure
Two-slide set. Slide 1: 'Cost Analysis' title + left table (10 rows × 5 columns: Value1–Value10, years 2026–2030) + right line graph (2 data series, 5 data points, gray highlight zones). Slide 2: identical layout with green header. 16:9 widescreen format, PPTX file.
Related Products
-

Selling Cost Analysis Chart – Clearly Illustrating Financial Performance
#Financial Plans and Performance #Diagram #Graph
-

Cost Increase Rate Analysis Chart
#Financial Plans and Performance #Diagram #Graph
-

Business Outlook Analysis Chart – Future Predictions and Planning
#Financial Plans and Performance #Diagram #Graph
-

Business Operation Cost Analysis Graph – Core of Financial Planning
#Financial Plans and Performance #Diagram #Graph
