Market Trend Analysis Chart – Effective Data Visualization
RM0600006_9
- Last Update 02/25/2025
- File Size 1.8MB
- # of Slides 2
- File Format PPTX
- Slide Ratio 16:9
- Color
Keywords
- #Content-Based Slides
- #Design-Based Slides
- #Market and Competitor Analysis
- #Graph
- #Market Analysis
- #Industry Trends
- #Horizontal Bar
- #Circles
- #Horizontal Bar Chart
- #Doughnut Chart
- #16:9
- #donut chart PowerPoint slide
- #pie chart template
- #market analysis graph
- #data visualization PowerPoint
- #ratio chart template
About the Product
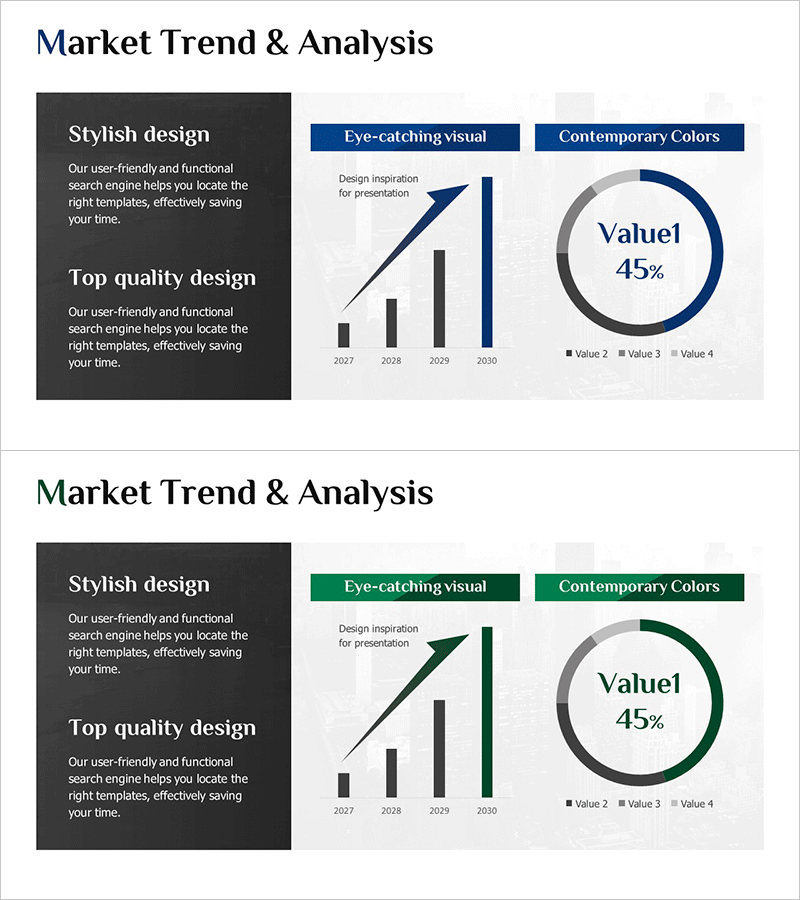
A professional donut chart PowerPoint slide designed for market trend analysis and data visualization. This 2-slide set combines a horizontal bar graph with a donut pie chart to present both comparative metrics and proportional data simultaneously. Dark background text boxes paired with navy and green accent colors enhance presentation credibility. Ideal for marketing reports, business analysis presentations, and market research briefings. All chart values, labels, and colors are fully editable to match your specific data and brand guidelines.
Usage Points
-
Main Usage
Display market share, sales performance, customer satisfaction, or demographic distribution using the donut chart format. Simultaneously compare year-over-year or category-based metrics with the horizontal bar graph. Perfect for the analysis section of executive reports to communicate key indicators at a glance.
-
How to Use
Slide 1: Enter analysis context in the left text area and input year-by-year data in the right bar graph. Slide 2: Adjust donut chart segments and legend labels to reflect your actual data. Modify colors to align with corporate branding. All elements support direct editing in PowerPoint.
-
Recommended For
Marketing managers, executives, business analysts, and consultants preparing quarterly or annual performance reports, market share analysis, customer segmentation studies, and investor presentations. Enhances credibility in board meetings, client proposals, and stakeholder briefings.
-
Slide Structure
Slide 1: Dark background with 2-section text box + navy header + horizontal bar graph (4 years × 4 data series). Slide 2: Green header + donut chart (4 segments with center value display) + 4-item legend. Full 16:9 aspect ratio, PPTX format, 2 slides total.
Related Products
-

Latest Trend Analysis Bar & Donut Charts
#Market and Competitor Analysis #Graph #Market Analysis
-

Premium Coffee Customer Demographics and Popular Menu – Comprehensive Customer Analysis
#Market and Competitor Analysis #Customer Success Stories #Graph
-

Chart of Industry Change and Global Market Outlook Analysis
#Market and Competitor Analysis #Graph #Market Analysis
-

Market Analysis Template with Line Graphs and Horizontal Bar Charts
#Market and Competitor Analysis #Graph #Market Analysis
