Balance Sheet Diagram Slide – Clear and Modern Design
RM0600006_26
- Last Update 02/24/2025
- File Size 0.8MB
- # of Slides 2
- File Format PPTX
- Slide Ratio 16:9
- Color
Keywords
About the Product
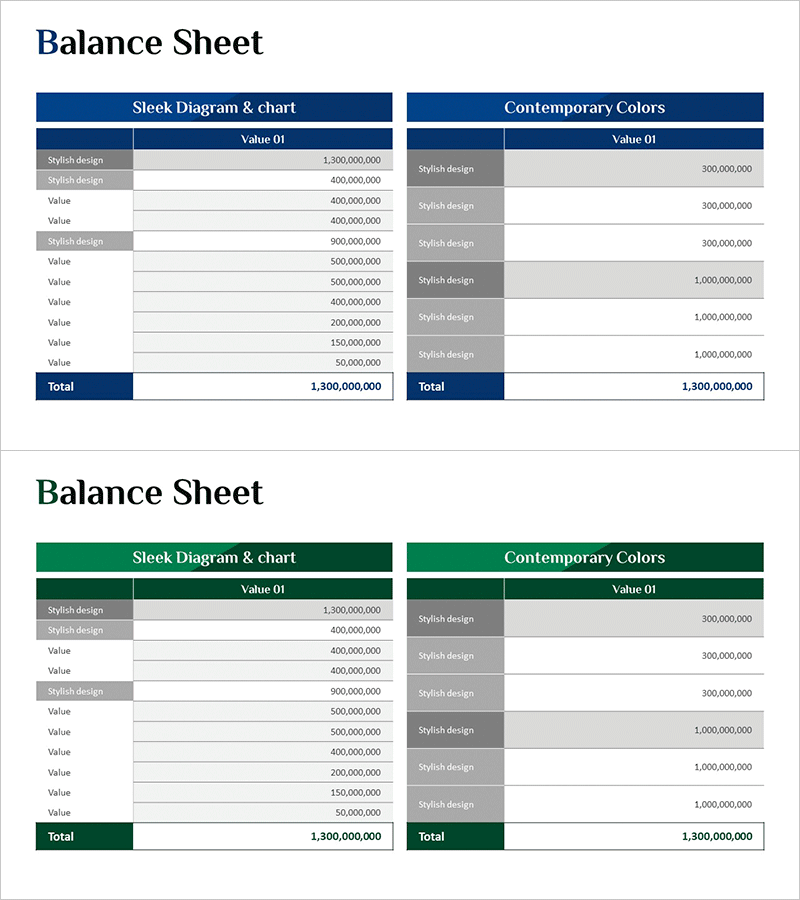
A financial statement diagram PowerPoint slide designed for accounting presentations and balance sheet analysis. The slide features a two-column layout with 'Sleek Diagram & Chart' on the left and 'Contemporary Colors' on the right, each displaying assets, liabilities, and equity items in a structured table format. Available in two color schemes—navy blue and forest green—to match corporate branding and presentation tone. Delivered as a 2-slide deck in 16:9 widescreen format with fully editable cells for item names and monetary values. The table structure enables quick comparison of financial data and supports immediate integration of actual balance sheet figures into your presentation.
Usage Points
-
Main Usage
Present balance sheet components—assets, liabilities, and equity—in a systematic visual format. The two-column comparison structure allows simultaneous presentation of two accounting perspectives (sleek vs. contemporary design). Ideal for quarterly/annual financial reporting, investor presentations, board meetings, and internal financial briefings.
-
How to Use
Double-click each cell to replace placeholder text with actual financial data. Select your preferred color scheme (navy blue or forest green) to align with corporate branding. Add or remove rows as needed to match your account structure. Insert into presentation decks or use as standalone financial summary slides.
-
Recommended For
CFOs, accounting professionals, financial analysts, investor relations (IR) managers, banking executives, business school instructors, MBA students, and finance teams preparing balance sheet presentations and financial disclosures.
-
Slide Structure
2-slide deck. Each slide contains two side-by-side tables with header row (section title) and data rows (item names and values). Slide 1 features navy blue headers; Slide 2 uses forest green headers for color variation. Accommodates 10–12 data rows per table to display comprehensive asset, liability, and equity categories.
Related Products
-

Introduction to Company History – Visualizing with Linearity and Clusters
#Company Introduction #Operational Plan #Diagram
-

PowerPoint Template for Service Operation Strategy Presentation
#Business Management #Operational Plan #Technical Approach
-

Infographic Slide Visualizing Core Cosmetics Components
#Business Strategy #Operational Plan #Diagram
-

Website Analysis Configuration Contents – Diagram and Cluster Explanation
#Product/Service Introduction #Diagram #Composition
