Stock Structure and Issuance History Analysis Table – Integrated Financial Data
RM0600006_7
- Last Update 02/25/2025
- File Size 1MB
- # of Slides 2
- File Format PPTX
- Slide Ratio 16:9
- Color
Keywords
- #Content-Based Slides
- #Design-Based Slides
- #Financial Plans and Performance
- #Diagram
- #Capital Requirements
- #Projected Return on Investment (ROI)
- #Table
- #Standard Table
- #16:9
- #stock structure table PowerPoint
- #financial data analysis slide
- #share issuance history template
- #investment return table
- #table diagram PowerPoint slide
About the Product
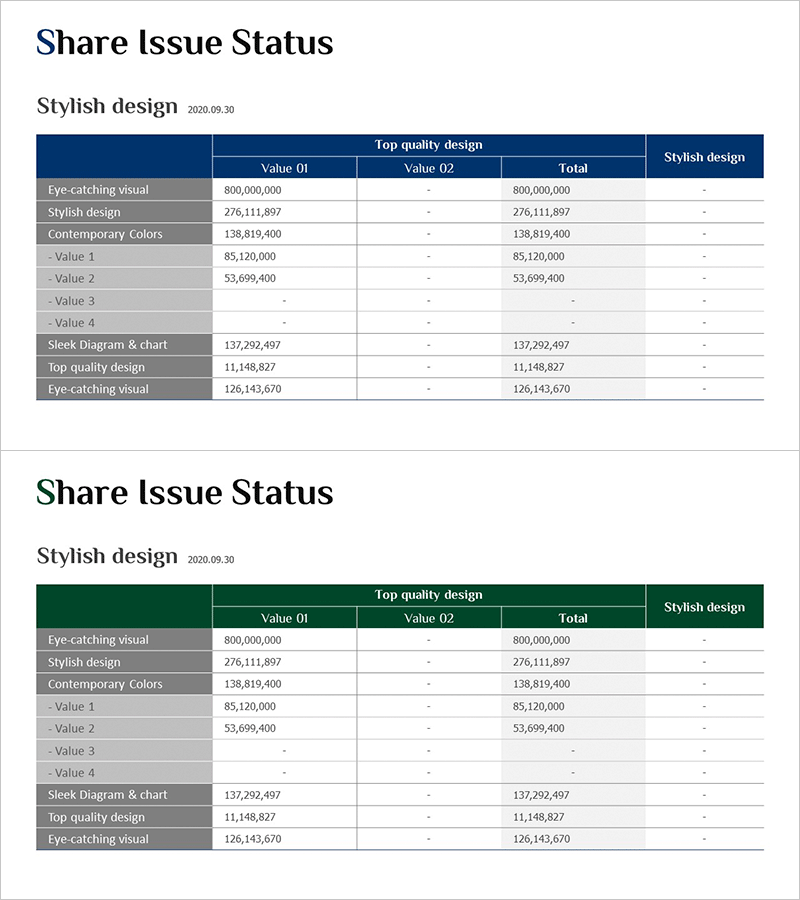
A 2-slide PowerPoint presentation designed to organize stock issuance history and equity structure with clarity. Features a horizontal table layout with dark blue header and gray rows for systematic financial data display. Accommodates multiple financial metrics including share count, issuance price, and return on investment in a single comparative view. Each row uses distinct color coding to establish clear information hierarchy, enabling immediate use in investor presentations. Provided in 16:9 widescreen PPTX format with editable text and numeric fields for seamless customization.
Usage Points
-
Main Usage
Present equity structure and share issuance details in investor pitch decks, business plans, and financial reports. Enables side-by-side comparison of multiple financial metrics to support investment decision-making with clear data visualization.
-
How to Use
Input stock types, share quantities, issuance prices, and ROI figures into the table rows. Edit text fields and update numeric values to customize for your presentation. Use row color differentiation to emphasize priority items and data categories.
-
Recommended For
CFOs, financial analysts, investment managers, and executives presenting equity analysis and financial status. Ideal for startup fundraising pitches, M&A documentation, shareholder meetings, and quarterly financial reviews.
-
Slide Structure
2-slide deck with first slide showing stock structure analysis table (dark blue header with 5-6 gray data rows) and second slide displaying issuance history analysis table (matching layout). Each table supports 2+ data columns with adjustable row heights and column widths for flexible data entry.
Related Products
-

Stock Structure and Issuance History Analysis Table – Efficient Data Visualization
#Financial Plans and Performance #Diagram #Capital Requirements
-

Stock Status Analysis Table – A Tool for Financial Planning and Performance
#Financial Plans and Performance #Diagram #Capital Requirements
-

Stock Issuance Status Analysis Chart – Financial Planning and Performance
#Financial Plans and Performance #Diagram #Capital Requirements
-

Curved Theme Purple Template Diagram – Investment Planning and Performance
#Financial Plans and Performance #Diagram #Capital Requirements
