Industrial Market Outlook Analysis Graph – Market Status and Growth Potential
RM0600006_17
- Last Update 02/24/2025
- File Size 1.5MB
- # of Slides 2
- File Format PPTX
- Slide Ratio 16:9
- Color
Keywords
- #Content-Based Slides
- #Design-Based Slides
- #Market and Competitor Analysis
- #Graph
- #Market Status
- #Future Outlook
- #Horizontal Bar
- #Horizontal Bar Chart
- #16:9
- #dual bar chart PowerPoint
- #comparative analysis chart slide
- #market data visualization
- #industrial outlook graph
- #bar graph PowerPoint slide template
About the Product
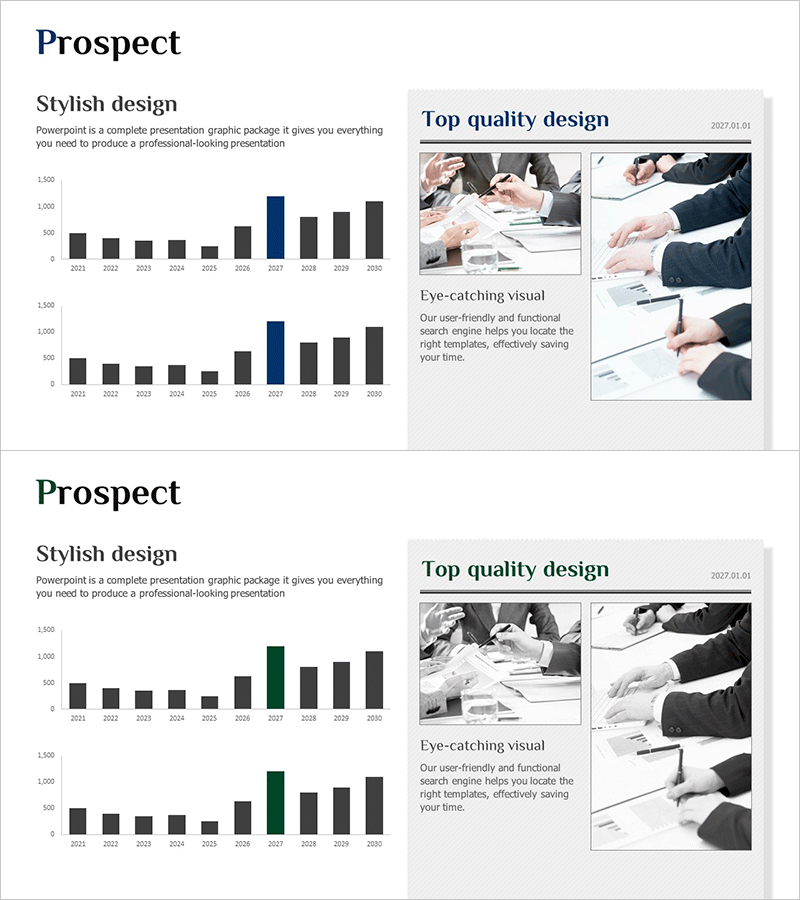
A dual bar chart PowerPoint slide designed to visualize industrial market outlook and growth potential. This presentation slide compares 10 years of data from 2011 to 2030 across two data series, effectively displaying market status and growth trends simultaneously. The design uses navy blue and black bar colors to emphasize contrast, with a left text section conveying 'stylish design' and professionalism. The right image area features a business meeting scene to reinforce credibility. This slide deck is ready for immediate use in reports, presentations, and analytical materials.
Usage Points
-
Main Usage
Visualize year-over-year and item-by-item numerical comparisons using dual bar charts. Express two data series simultaneously to clearly communicate differences and trends in industrial market status, growth rates, and performance metrics.
-
How to Use
Enter title and description in the left text area, and insert relevant images in the right image section. Adjust bar heights and colors to match your data, then apply to business reports, market analysis documents, investment proposals, and strategic presentations.
-
Recommended For
Marketing managers, business analysts, financial reporting specialists, and consultants benefit from this slide when presenting market analysis, growth trends, and competitive comparisons. Ideal for industry reports, quarterly earnings presentations, and strategic planning meetings to enhance data credibility.
-
Slide Structure
2-slide layout. Each slide divides into left dual bar graphs (top and bottom arrangement) and right image area. Bars represent 2 data series (navy blue and black) across 10 years, with vertical axis scaled 0–1500. 16:9 widescreen PPTX format.
Related Products
-

Business Future Outlook Analysis Chart
#Market and Competitor Analysis #Graph #Market Status
-

Global Market Future Outlook Chart – Forward-Looking Business Analysis
#Market and Competitor Analysis #Graph #Market Status
-

IT Industry Market Outlook Analysis Graph – Current Market Status and Future Prospects
#Market and Competitor Analysis #Diagram #Graph
-

Medical Services Characteristics Connection Diagram
#Market and Competitor Analysis #Graph #Market Status
