Obesity PPT Wide Template – Design for Healthy Lifestyle
J0600066
- Last Update 01/18/2025
- File Size 9.4MB
- # of Slides 20
- File Format PPTX
- Slide Ratio 16:9
- Color
Slide Preview


Keywords
About the Product
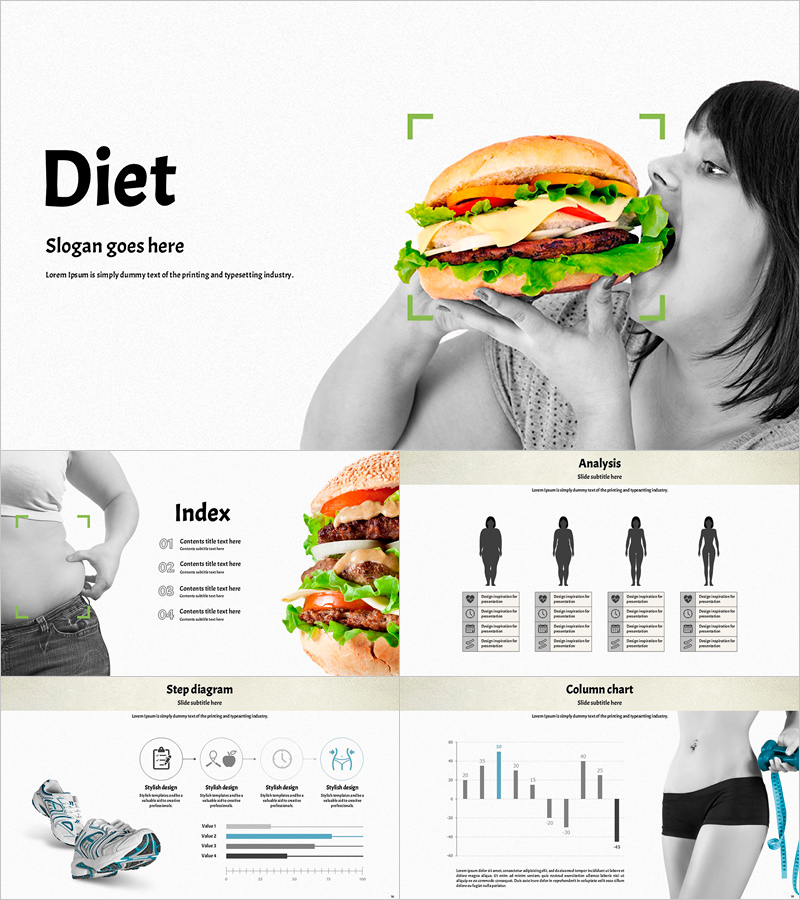
This PowerPoint template for diet and obesity management topics features a striking contrast between black-and-white portrait photography and full-color food imagery. Built on a light gray and cream beige background with green accent colors, the design delivers strong visual impact for health and nutrition presentations. The 20-slide PPTX set includes a cover slide, table of contents, body shape silhouette infographic, step diagram, column chart, horizontal bar chart, and timeline graph slides. Each layout is fully editable — swap text, images, and chart data to match your content. Ideal for healthcare campaigns, nutrition education sessions, diet program promotions, and wellness service introductions. Charts and infographics update instantly when you enter new data, significantly reducing preparation time for your next presentation or seminar.
Usage Points
-
Main Usage
Designed for presenting diet programs, obesity prevention education, healthy lifestyle campaigns, and nutrition-related topics in corporate wellness, clinical, or academic settings.
-
How to Use
Open the PPTX file and replace placeholder text, images, and chart data with your own content. Swap the black-and-white portrait photos with real case images and adjust the green accent color to match your brand identity.
-
Recommended For
Healthcare companies, nutritionists, personal trainers, hospital marketing teams, health educators, and diet app or wellness service marketers who need a visually impactful presentation template.
-
Slide Structure
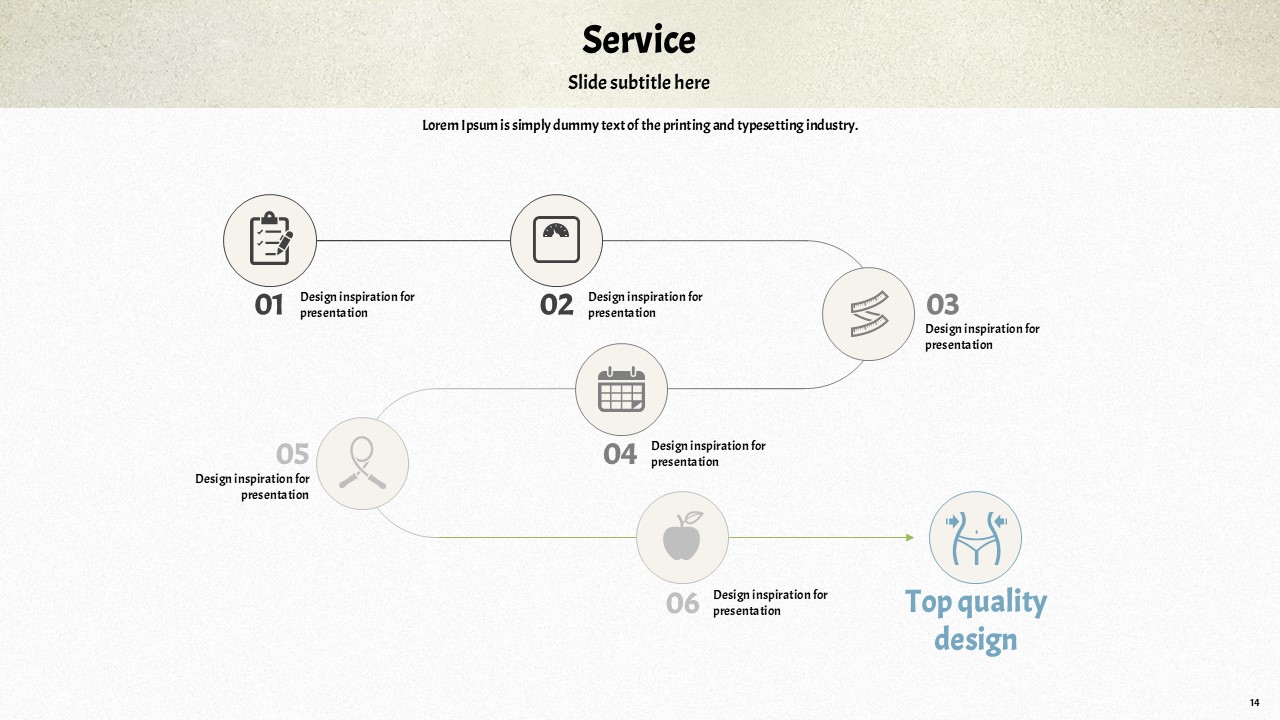
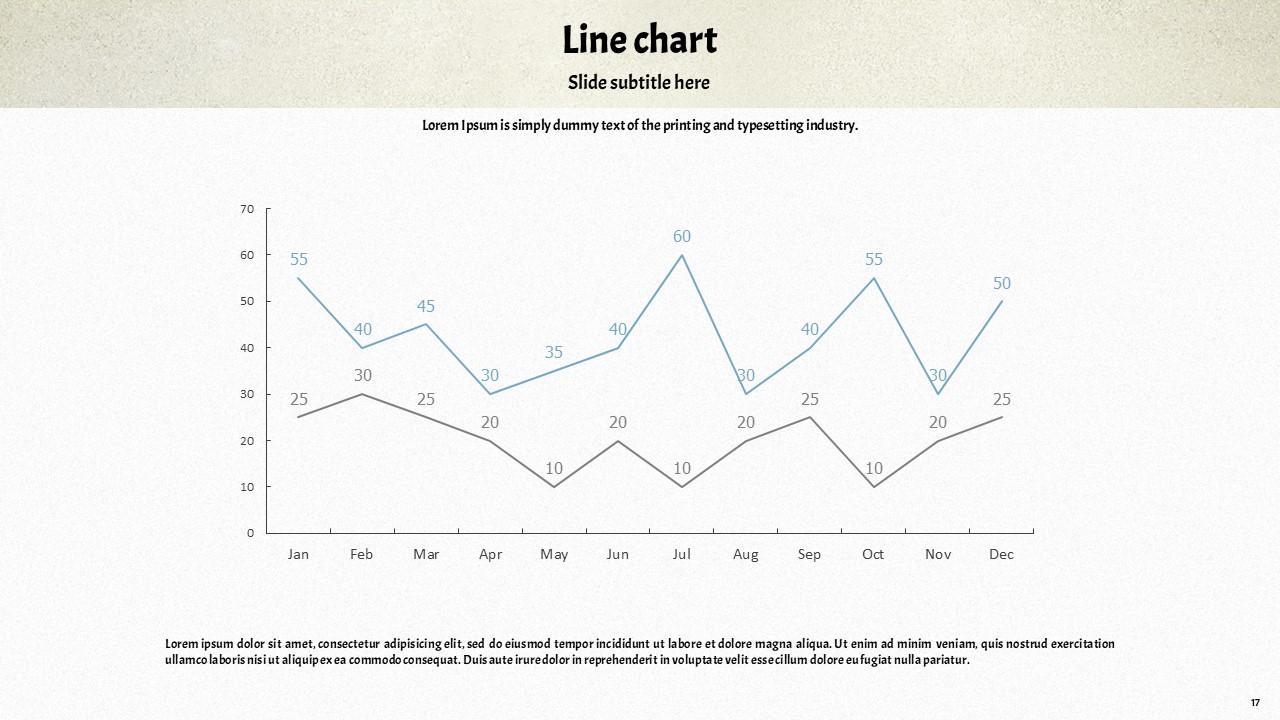
20 slides including a cover (B&W portrait vs. color burger contrast), 4-item table of contents, body shape silhouette infographic, 4-step icon diagram, column chart, horizontal bar chart, and a green line timeline graph spanning 2019–2027.


