Hamburger Yearly Rising Curve – Growth and Innovation
RJ0600066_3
- Last Update 07/07/2025
- File Size 8.8MB
- # of Slides 2
- File Format PPTX
- Slide Ratio 16:9
- Color
Keywords
About the Product
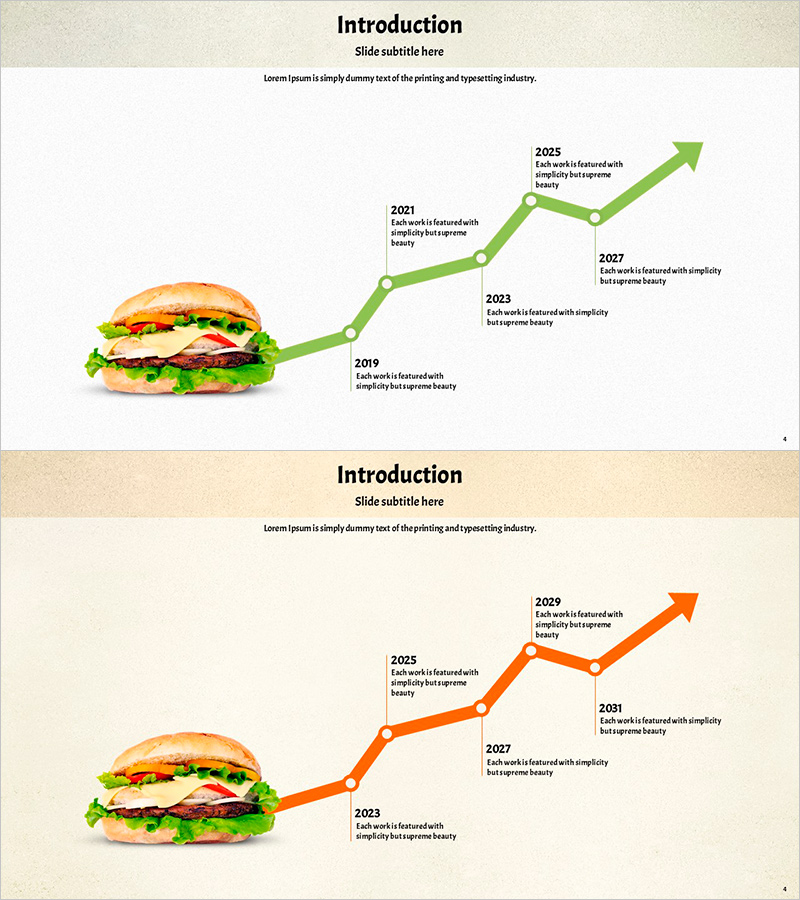
A timeline-based PowerPoint slide that visualizes year-over-year growth progression. Featuring a hamburger image alongside an ascending curve spanning from 2019 to 2027 (or 2029), with each annual milestone marked in green or orange. Text input areas at each year point allow you to add performance descriptions, making it ideal for business growth, product development phases, market expansion, and strategic initiatives. Delivered in 16:9 widescreen PPTX format for immediate editing and customization.
Usage Points
-
Main Usage
Visualize annual business growth, product development stages, market entry timelines, and revenue increase trends across time. Ideal for investor pitches, executive reports, and strategic planning meetings to clearly communicate achievements and future plans.
-
How to Use
Enter actual performance data, targets, or milestones into the text boxes corresponding to each year point (2019, 2021, 2023, 2025, 2027, etc.). Select your preferred curve color (green or orange) and modify years and text as needed to match your presentation content.
-
Recommended For
Business strategy presentations, new business initiatives, product roadmaps, market entry schedules, revenue growth targets, and organizational expansion plans presented by executives, business teams, and marketing departments.
-
Slide Structure
Symbolic image (hamburger) on the left; ascending curve with 5 year-marked points on the right. Each point includes one year label and text input area. Two-slide set with color variations (green and orange options).
Related Products
-

Global Network Template Section Slide 01 – Cover Slide Filled with Innovation and Vision
#Slide Type #Section Cover
-

Logistics Business Template Section Slide 01 – Emphasizing Professionalism
#Slide Type #Section Cover
-

Business Meeting Divider – The Start of Effective Communication
#Slide Type #Section Cover
-

Idea Building Folder Section Slide – Thorough Preparation and Professionalism
#Slide Type #Section Cover
