A Lively Green Orange Pie Chart
RJ0600066_9
- Last Update 07/07/2025
- File Size 8.5MB
- # of Slides 2
- File Format PPTX
- Slide Ratio 16:9
- Color
Keywords
- #Content-Based Slides
- #Design-Based Slides
- #Market and Competitor Analysis
- #Graph
- #Market Share
- #Market Analysis
- #Circles
- #Pie Chart
- #16:9
- #pie chart PowerPoint slide
- #4-segment pie chart template
- #market share visualization
- #ratio chart PowerPoint
- #data visualization slide
- #pie graph template download
About the Product
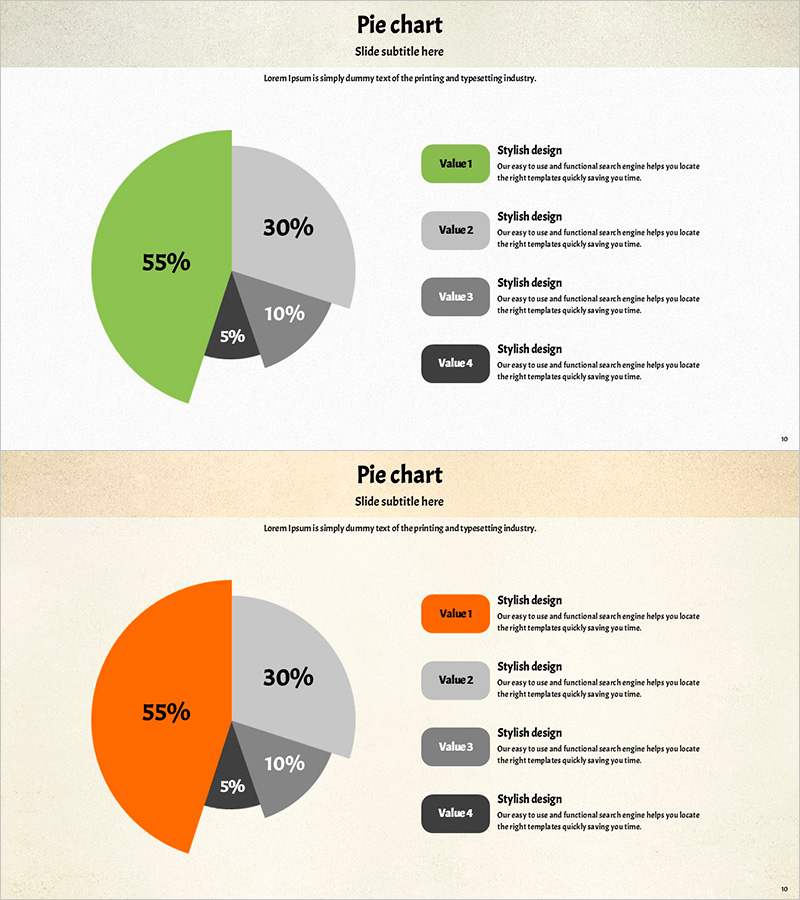
A professional pie chart PowerPoint slide set designed to visualize market share, data proportions, and business metrics with clarity. Featuring a 4-segment layout in green and orange two-tone colors, this 2-slide template includes percentage labels and legend descriptions for immediate presentation use. Ideal for market analysis, sales reports, customer demographics, and budget allocation presentations. Each segment is clearly labeled with values and supporting text, making complex data accessible to your audience.
Usage Points
-
Main Usage
Clearly display the proportion of each category relative to the whole using percentages. The 4-segment layout allows simultaneous comparison of up to four data categories, with integrated legend and numerical labels that enhance audience comprehension and retention of key metrics.
-
How to Use
Perfect for marketing reports, business analysis presentations, financial updates, and market research findings. Simply replace the sample percentages and labels with your actual data to create a polished, professional presentation. The 2-slide format supports comparative analysis and trend visualization across time periods.
-
Recommended For
Marketing managers, sales directors, financial analysts, business executives, management consultants, and data analysts. Ideal for quarterly performance reviews, customer segmentation analysis, product sales composition explanations, and stakeholder reporting.
-
Slide Structure
Each slide features a title area, 4-segment pie chart (green 55%, orange 30%, gray 10%, black 5%), and right-aligned legend section with Value 1-4 labels and descriptive text. Optimized for 16:9 widescreen format with consistent layout across both slides for cohesive presentation flow.
Related Products
-

Market Analysis Report Visualized with Pie Chart
#Market and Competitor Analysis #Diagram #Graph
-

Market Share Circle Graph – Ideal for Market Analysis
#Market and Competitor Analysis #Graph #Market Share
-

Design Pattern Template Pie Chart – Market Share Analysis
#Market and Competitor Analysis #Graph #Market Share
-

Market Analysis by Year Pie Chart – Emphasizing Market Share
#Market and Competitor Analysis #Graph #Market Share
