Dynamic Line Graph – Market and Competitor Analysis
RJ0600066_16
- Last Update 07/07/2025
- File Size 8.5MB
- # of Slides 2
- File Format PPTX
- Slide Ratio 16:9
- Color
Keywords
- #Content-Based Slides
- #Design-Based Slides
- #Market and Competitor Analysis
- #Graph
- #Market Status
- #Competitive Advantage
- #Line
- #Line Chart
- #16:9
- #line chart PowerPoint
- #monthly trend comparison slide
- #dual-series data visualization
- #market analysis chart
- #competitor performance PPT
- #trend tracking template
About the Product
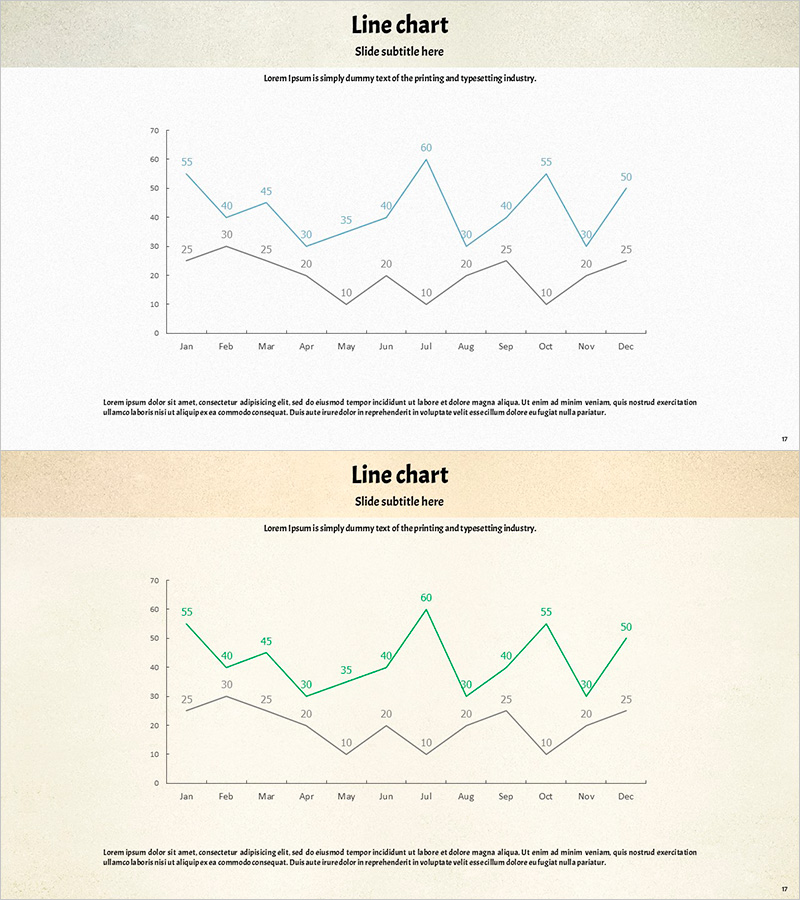
A dual-series line chart PowerPoint slide that compares monthly data trends across two datasets. Featuring a beige background with blue and gray line series, this presentation slide effectively visualizes market dynamics and competitive performance side by side. Each of the 12 monthly data points is clearly labeled with numerical values for precise comparison. Ideal for business reports, market analysis presentations, and performance tracking documents that require clear visualization of trend changes and comparative metrics.
Usage Points
-
Main Usage
Visualizes monthly trend changes and comparative performance between two data series. Effectively communicates market analysis, competitive benchmarking, quarterly and monthly performance trends, and time-based numerical changes in executive reports and strategic presentations.
-
How to Use
Insert into market analysis sections of business reports, executive briefing materials, and performance forecast sections of business plans. Replace sample data with actual figures for immediate presentation use. Customize line colors and styles to match corporate branding and presentation themes.
-
Recommended For
Marketing managers, financial analysts, executives, consultants, and data analysts use this template for quarterly reports, performance analysis, and market research presentations. Suitable for visualizing competitive analysis, sales trends, customer satisfaction changes, and other comparative metrics.
-
Slide Structure
Comprises two-series line chart with 12-month X-axis (January through December) and numerical Y-axis scale (0-70). Each data point displays precise numerical labels for accurate reference. Includes legend and descriptive text areas. Two-slide set provides alternative color combinations and chart variations.
Related Products
-

Blue Green Basic Line Chart – Market Status and Competitive Analysis
#Market and Competitor Analysis #Graph #Market Status
-

Line Graph for Market Trends Visualization – Competitive Advantage Analysis
#Market and Competitor Analysis #Graph #Market Status
-

Line Graph for Camping Market Analysis – Market Trends and Competitive Advantage
#Market and Competitor Analysis #Graph #Market Status
-

Comparison of Change Curves – Market and Competitor Analysis
#Market and Competitor Analysis #Graph #Market Status
